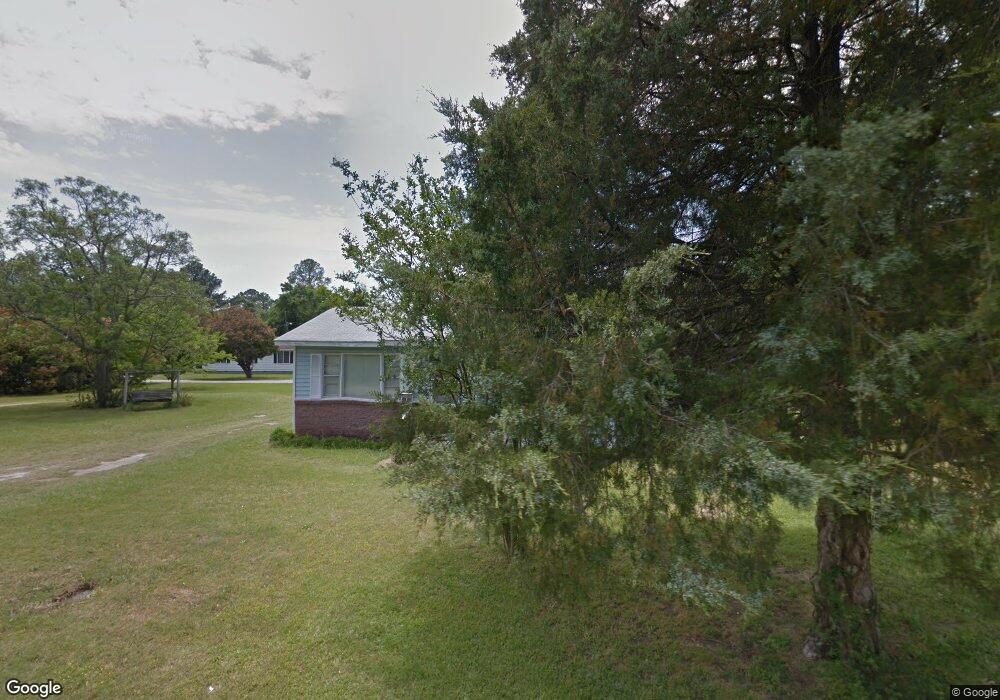
118 S 4th St Cochran, GA 31014
Estimated Value: $69,275 - $130,000
1
Bed
1
Bath
816
Sq Ft
$111/Sq Ft
Est. Value
About This Home
This home is located at 118 S 4th St, Cochran, GA 31014 and is currently estimated at $90,819, approximately $111 per square foot. 118 S 4th St is a home located in Bleckley County with nearby schools including Bleckley County Primary School, Bleckley County Elementary School, and Bleckley Middle School.
Ownership History
Date
Name
Owned For
Owner Type
Purchase Details
Closed on
Mar 31, 2023
Sold by
A & N Management Llc
Bought by
Momin Investments Llc
Current Estimated Value
Purchase Details
Closed on
Sep 23, 2022
Sold by
Chancey Melvin
Bought by
A & N Management Llc
Purchase Details
Closed on
May 18, 1990
Sold by
Evans Lansing A
Bought by
Chancey Melvin
Purchase Details
Closed on
Sep 22, 1989
Sold by
Evans Charles Chris
Bought by
Evans Lansing A
Purchase Details
Closed on
Apr 23, 1988
Bought by
Evans Charles Chris
Create a Home Valuation Report for This Property
The Home Valuation Report is an in-depth analysis detailing your home's value as well as a comparison with similar homes in the area
Home Values in the Area
Average Home Value in this Area
Purchase History
| Date | Buyer | Sale Price | Title Company |
|---|---|---|---|
| Momin Investments Llc | -- | -- | |
| A & N Management Llc | $25,000 | -- | |
| Chancey Melvin | -- | -- | |
| Evans Lansing A | -- | -- | |
| Evans Charles Chris | -- | -- |
Source: Public Records
Tax History
| Year | Tax Paid | Tax Assessment Tax Assessment Total Assessment is a certain percentage of the fair market value that is determined by local assessors to be the total taxable value of land and additions on the property. | Land | Improvement |
|---|---|---|---|---|
| 2025 | $598 | $16,000 | $1,760 | $14,240 |
| 2024 | $603 | $16,000 | $1,760 | $14,240 |
| 2023 | $268 | $16,000 | $1,760 | $14,240 |
| 2022 | $390 | $14,320 | $1,760 | $12,560 |
| 2021 | $321 | $11,320 | $1,760 | $9,560 |
| 2020 | $323 | $11,320 | $1,760 | $9,560 |
| 2019 | $317 | $11,110 | $2,600 | $8,510 |
| 2018 | $449 | $11,110 | $2,600 | $8,510 |
| 2017 | $321 | $11,110 | $2,600 | $8,510 |
| 2016 | $324 | $11,110 | $2,600 | $8,510 |
| 2015 | -- | $11,110 | $2,600 | $8,510 |
| 2014 | -- | $11,110 | $2,600 | $8,510 |
| 2013 | -- | $11,110 | $2,600 | $8,510 |
Source: Public Records
Map
Nearby Homes
Your Personal Tour Guide
Ask me questions while you tour the home.