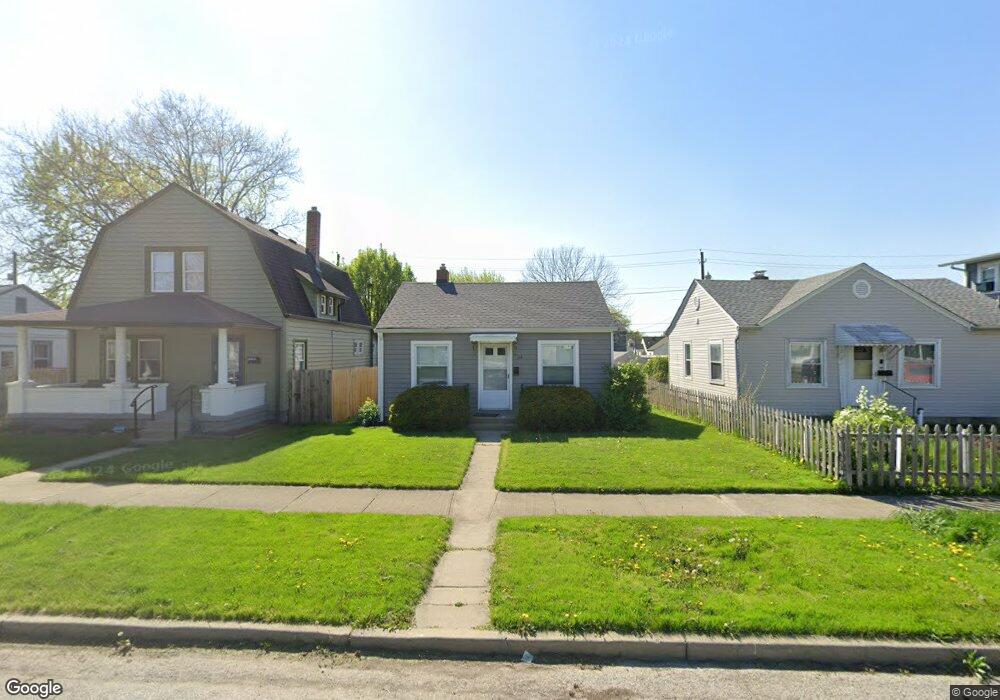
118 S 5th Ave Unit B175 Beech Grove, IN 46107
Estimated Value: $171,000 - $196,000
3
Beds
1
Bath
1,416
Sq Ft
$132/Sq Ft
Est. Value
About This Home
This home is located at 118 S 5th Ave Unit B175, Beech Grove, IN 46107 and is currently estimated at $186,436, approximately $131 per square foot. 118 S 5th Ave Unit B175 is a home located in Marion County with nearby schools including Hornet Park Elementary School, Central Elementary School, and South Grove Intermediate School.
Ownership History
Date
Name
Owned For
Owner Type
Purchase Details
Closed on
Sep 27, 2006
Sold by
Browfield Jean M and The Jean M Browfield Trust
Bought by
Osborn Sandra K
Current Estimated Value
Home Financials for this Owner
Home Financials are based on the most recent Mortgage that was taken out on this home.
Original Mortgage
$73,841
Outstanding Balance
$44,038
Interest Rate
6.45%
Mortgage Type
FHA
Estimated Equity
$142,398
Create a Home Valuation Report for This Property
The Home Valuation Report is an in-depth analysis detailing your home's value as well as a comparison with similar homes in the area
Home Values in the Area
Average Home Value in this Area
Purchase History
| Date | Buyer | Sale Price | Title Company |
|---|---|---|---|
| Osborn Sandra K | -- | None Available |
Source: Public Records
Mortgage History
| Date | Status | Borrower | Loan Amount |
|---|---|---|---|
| Open | Osborn Sandra K | $73,841 |
Source: Public Records
Tax History Compared to Growth
Tax History
| Year | Tax Paid | Tax Assessment Tax Assessment Total Assessment is a certain percentage of the fair market value that is determined by local assessors to be the total taxable value of land and additions on the property. | Land | Improvement |
|---|---|---|---|---|
| 2024 | $1,843 | $157,800 | $17,000 | $140,800 |
| 2023 | $1,843 | $140,500 | $17,000 | $123,500 |
| 2022 | $1,746 | $129,800 | $17,000 | $112,800 |
| 2021 | $1,402 | $110,000 | $17,000 | $93,000 |
| 2020 | $1,182 | $98,900 | $17,000 | $81,900 |
| 2019 | $1,105 | $95,400 | $14,000 | $81,400 |
| 2018 | $923 | $83,100 | $14,000 | $69,100 |
| 2017 | $916 | $81,300 | $14,000 | $67,300 |
| 2016 | $880 | $78,900 | $14,000 | $64,900 |
| 2014 | $745 | $71,300 | $14,000 | $57,300 |
| 2013 | $658 | $63,600 | $14,000 | $49,600 |
Source: Public Records
Map
Nearby Homes