
Seller's Agent in 2020
Matt Misener
RE/MAX
(541) 930-2686
195 Total Sales
Estimated Value: $276,000 - $346,000
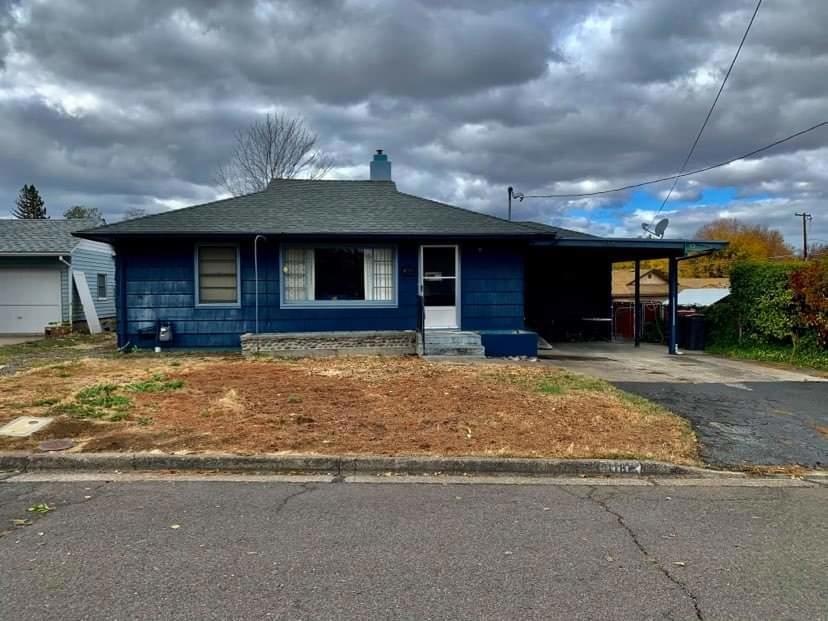
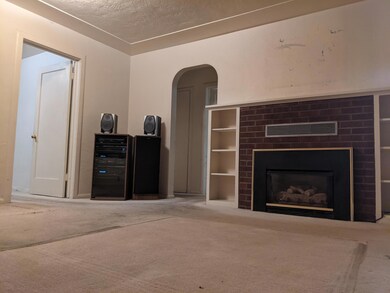
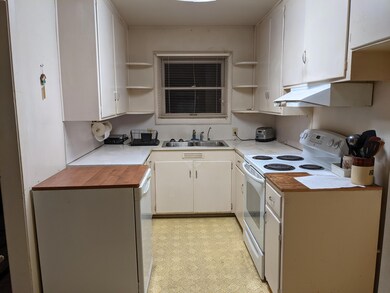
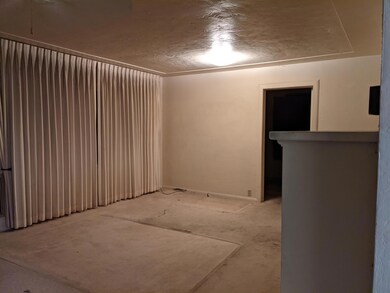
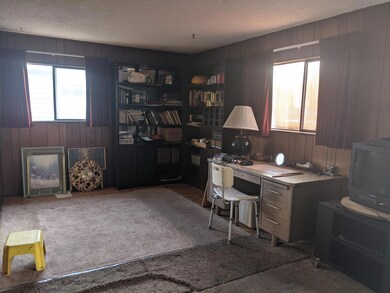
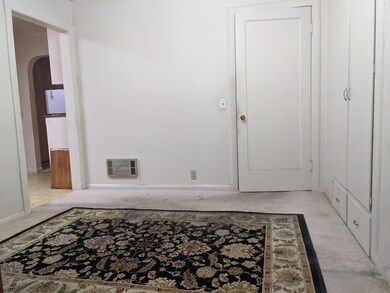
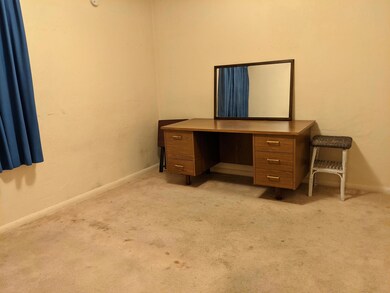
This Central Point home has three bedrooms and 1 1/2 bathrooms. Over 1300 sq. ft with hardwood floors under the carpet. This home has a gas fireplace in the living room. Kitchen has plenty of counters. The home has great parking with a carport and single car garage. There is a storage shed attached to the back of the garage. Needs some TLC but the potential is there! Must tour!
Last Agent to Sell the Property
RE/MAX Platinum License #201212971 Listed on: 11/13/2020
We collect this data history from publicly available records. To have your information removed, we recommend requesting removal directly through your county’s website.
We collect this data history from publicly available records. To have your information removed, we recommend requesting removal directly through your county’s website.
| Date | Buyer | Sale Price | Title Company |
|---|---|---|---|
| $236,500 | Ticor Title |
We collect this data history from publicly available records. To have your information removed, we recommend requesting removal directly through your county’s website.
| Date | Status | Borrower | Loan Amount |
|---|---|---|---|
| Open | $224,675 |
We collect this data history from publicly available records. To have your information removed, we recommend requesting removal directly through your county’s website.
| Date | Event | Price | List to Sale | Price per Sq Ft |
|---|---|---|---|---|
| 12/31/2020 12/31/20 | Sold | $236,500 | -6.3% | $178 / Sq Ft |
| 11/25/2020 11/25/20 | Pending | -- | -- | -- |
| 11/12/2020 11/12/20 | For Sale | $252,500 | -- | $190 / Sq Ft |
We collect this data history from publicly available records. To have your information removed, we recommend requesting removal directly through your county’s website.
| Year | Tax Paid | Tax Assessment Tax Assessment Total Assessment is a certain percentage of the fair market value that is determined by local assessors to be the total taxable value of land and additions on the property. | Land | Improvement |
|---|---|---|---|---|
| 2026 | $2,735 | $165,280 | ||
| 2025 | $2,668 | $160,470 | $85,760 | $74,710 |
| 2024 | $2,668 | $155,800 | $83,270 | $72,530 |
| 2023 | $2,582 | $151,270 | $80,850 | $70,420 |
| 2022 | $2,522 | $151,270 | $80,850 | $70,420 |
| 2021 | $2,450 | $146,870 | $78,500 | $68,370 |
| 2020 | $2,379 | $142,600 | $76,220 | $66,380 |
| 2019 | $2,320 | $134,420 | $71,850 | $62,570 |
| 2018 | $2,249 | $130,510 | $69,760 | $60,750 |
| 2017 | $2,193 | $130,510 | $69,760 | $60,750 |
| 2016 | $2,122 | $123,020 | $65,760 | $57,260 |
| 2015 | $1,921 | $118,040 | $44,690 | $73,350 |
| 2014 | $1,819 | $111,230 | $41,380 | $69,850 |
Seller's Agent in 2020
Matt Misener
RE/MAX
(541) 930-2686
195 Total Sales
Seller Co-Listing Agent in 2020
Jake Jakabosky
RE/MAX
(541) 973-5253
189 Total Sales
Buyer's Agent in 2020
Kimi Fernandez
RE/MAX
(541) 301-8332
43 Total Sales
Source: Oregon Datashare
MLS Number: 220112472
APN: 10134805
Disclaimer: Certain information contained herein is derived from information provided by parties other than Homes.com. All information provided is deemed reliable, but is not guaranteed to be accurate and should be independently verified.
![]() © 2026 Oregon Datashare (KCAR | MLSCO | SOMLS). All rights reserved. The data relating to real estate for sale on this web site comes in part from the Internet Data Exchange Program of the Oregon Datashare. Real estate listings held by IDX Brokerage firms other than Ten-X are marked with the Internet Data Exchange logo or the Internet Data Exchange thumbnail logo and detailed information about them includes the name of the listing Brokers. Information provided is for consumers' personal, non-commercial use and may not be used for any purpose other than to identify prospective properties the viewer may be interested in purchasing. The consumer will not copy, retransmit nor redistribute any of the content from this website. Information provided is deemed reliable, but not guaranteed.
© 2026 Oregon Datashare (KCAR | MLSCO | SOMLS). All rights reserved. The data relating to real estate for sale on this web site comes in part from the Internet Data Exchange Program of the Oregon Datashare. Real estate listings held by IDX Brokerage firms other than Ten-X are marked with the Internet Data Exchange logo or the Internet Data Exchange thumbnail logo and detailed information about them includes the name of the listing Brokers. Information provided is for consumers' personal, non-commercial use and may not be used for any purpose other than to identify prospective properties the viewer may be interested in purchasing. The consumer will not copy, retransmit nor redistribute any of the content from this website. Information provided is deemed reliable, but not guaranteed.
Ask me questions while you tour the home.