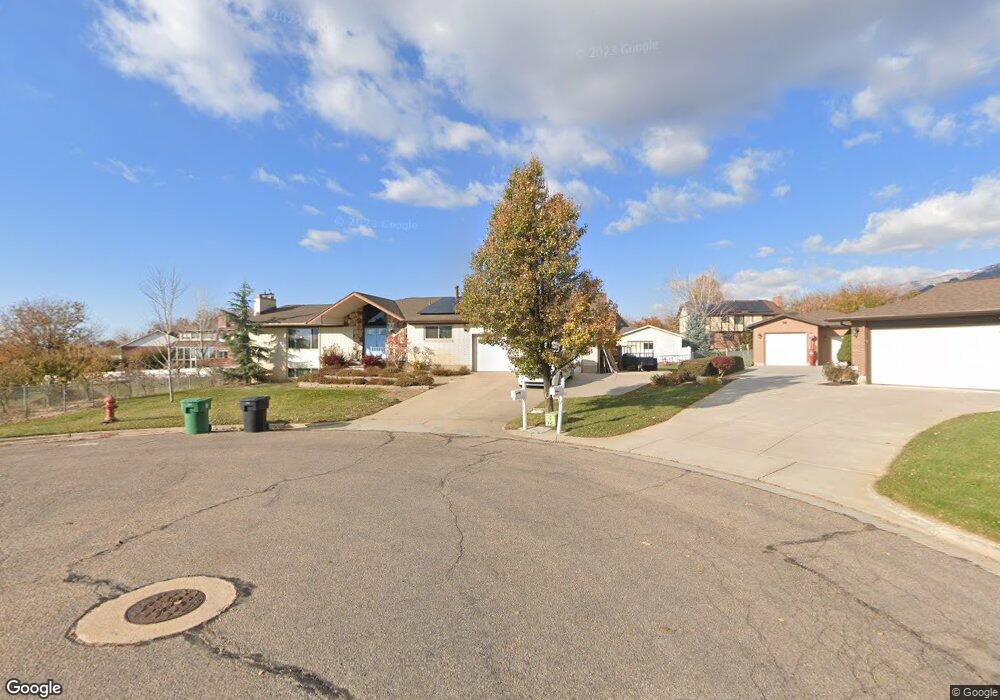
118 S Edgehill Cir Fruit Heights, UT 84037
Estimated Value: $662,000 - $901,676
6
Beds
3
Baths
4,497
Sq Ft
$179/Sq Ft
Est. Value
About This Home
This home is located at 118 S Edgehill Cir, Fruit Heights, UT 84037 and is currently estimated at $803,419, approximately $178 per square foot. 118 S Edgehill Cir is a home located in Davis County with nearby schools including H.C. Burton Elementary School, Kaysville Junior High School, and Davis High School.
Ownership History
Date
Name
Owned For
Owner Type
Purchase Details
Closed on
Jun 1, 2016
Sold by
Mccumber Mary A and Mccumber Aaron S
Bought by
Mccumber Mary A and Mccumber Aaron S
Current Estimated Value
Purchase Details
Closed on
Aug 13, 2014
Sold by
Hemphill Robert Warren and Hemphill Edwin Jacob
Bought by
Mccumber Mary A and Mccumber Aaron S
Home Financials for this Owner
Home Financials are based on the most recent Mortgage that was taken out on this home.
Original Mortgage
$355,300
Interest Rate
4.11%
Mortgage Type
New Conventional
Purchase Details
Closed on
Mar 24, 1998
Sold by
Hemphill Jacoba L
Bought by
Hemphill Jacoba L
Home Financials for this Owner
Home Financials are based on the most recent Mortgage that was taken out on this home.
Original Mortgage
$23,000
Interest Rate
6.67%
Create a Home Valuation Report for This Property
The Home Valuation Report is an in-depth analysis detailing your home's value as well as a comparison with similar homes in the area
Home Values in the Area
Average Home Value in this Area
Purchase History
| Date | Buyer | Sale Price | Title Company |
|---|---|---|---|
| Mccumber Mary A | -- | Inwest Title | |
| Mccumber Mary A | -- | First American Title | |
| Hemphill Jacoba L | -- | Backman Stewart Title Servic | |
| Hemphill Jacoba L | -- | Backman Stewart Title Servic |
Source: Public Records
Mortgage History
| Date | Status | Borrower | Loan Amount |
|---|---|---|---|
| Previous Owner | Mccumber Mary A | $355,300 | |
| Previous Owner | Hemphill Jacoba L | $23,000 |
Source: Public Records
Tax History Compared to Growth
Tax History
| Year | Tax Paid | Tax Assessment Tax Assessment Total Assessment is a certain percentage of the fair market value that is determined by local assessors to be the total taxable value of land and additions on the property. | Land | Improvement |
|---|---|---|---|---|
| 2024 | $4,047 | $414,701 | $289,053 | $125,648 |
| 2023 | $3,872 | $719,000 | $451,187 | $267,813 |
| 2022 | $4,161 | $421,850 | $234,570 | $187,280 |
| 2021 | $3,348 | $513,000 | $359,965 | $153,035 |
| 2020 | $3,053 | $453,000 | $307,971 | $145,029 |
| 2019 | $3,023 | $443,000 | $278,305 | $164,695 |
| 2018 | $2,831 | $409,000 | $191,666 | $217,334 |
| 2016 | $2,492 | $187,550 | $84,983 | $102,567 |
| 2015 | $2,444 | $174,955 | $84,983 | $89,972 |
| 2014 | $2,383 | $180,784 | $84,983 | $95,801 |
| 2013 | -- | $170,074 | $64,464 | $105,610 |
Source: Public Records
Map
Nearby Homes
- 947 E Green Rd
- 636 E 100 N
- 289 N 700 E
- 380 N 1000 E
- 1236 E 100 S
- 1351 E 400 S
- 272 Pin Oak Ln
- 331 E 100 S
- 309 E 100 S
- 1779 250 N Unit 29-R
- 1730 250 N Unit 23-R
- 1616 250 N Unit 26-R
- 399 Stirling Dr E
- 481 E Laurelwood Dr S
- 362 Glen Cir
- 617 E Whisper Creek Dr
- 673 S Main St
- 1425 250 N
- 425 E 500 N
- 87 E 100 S
- 119 Edgehill Cir
- 124 Edgehill Cir
- 127 Edgehill Cir
- 858 E Village Way
- 844 E Village Way
- 832 E Village Way
- 872 E Village Way
- 104 S Village Way
- 886 E Village Way
- 153 Edgehill Cir
- 120 S Village Way Unit 112
- 150 Edgehill Cir
- 48 S Village Way
- 150 S Edgehill Cir
- 855 E Village Way
- 138 S Village Way
- 42 S Village Way
- 841 E Village Way
- 869 E Village Way
- 170 Edgehill Cir