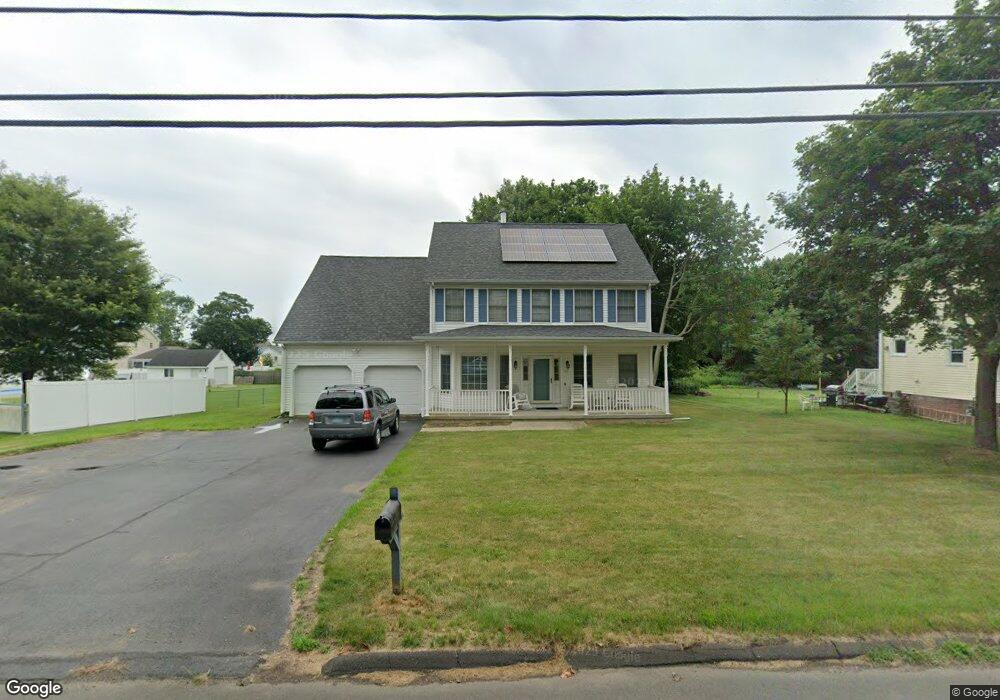
118 S End Rd East Haven, CT 06512
Estimated Value: $423,000 - $623,000
4
Beds
3
Baths
2,123
Sq Ft
$252/Sq Ft
Est. Value
About This Home
This home is located at 118 S End Rd, East Haven, CT 06512 and is currently estimated at $534,644, approximately $251 per square foot. 118 S End Rd is a home located in New Haven County with nearby schools including East Haven High School and Pathway School.
Ownership History
Date
Name
Owned For
Owner Type
Purchase Details
Closed on
Jun 25, 2014
Sold by
Higham John R
Bought by
Higham John R and Higham Richard J
Current Estimated Value
Purchase Details
Closed on
Nov 16, 1998
Sold by
Rose Robert K and Rose Adeline M
Bought by
Higham John R and Higham Mary
Create a Home Valuation Report for This Property
The Home Valuation Report is an in-depth analysis detailing your home's value as well as a comparison with similar homes in the area
Home Values in the Area
Average Home Value in this Area
Purchase History
| Date | Buyer | Sale Price | Title Company |
|---|---|---|---|
| Higham John R | -- | -- | |
| Higham John R | $45,000 | -- |
Source: Public Records
Mortgage History
| Date | Status | Borrower | Loan Amount |
|---|---|---|---|
| Open | Higham John R | $125,000 | |
| Previous Owner | Higham John R | $134,000 | |
| Previous Owner | Higham John R | $90,000 |
Source: Public Records
Tax History Compared to Growth
Tax History
| Year | Tax Paid | Tax Assessment Tax Assessment Total Assessment is a certain percentage of the fair market value that is determined by local assessors to be the total taxable value of land and additions on the property. | Land | Improvement |
|---|---|---|---|---|
| 2025 | $8,483 | $253,680 | $56,700 | $196,980 |
| 2024 | $8,483 | $253,680 | $56,700 | $196,980 |
| 2023 | $7,915 | $253,680 | $56,700 | $196,980 |
| 2022 | $7,915 | $253,680 | $56,700 | $196,980 |
| 2021 | $7,398 | $216,010 | $50,400 | $165,610 |
| 2020 | $7,398 | $216,010 | $50,400 | $165,610 |
| 2019 | $7,003 | $216,010 | $50,400 | $165,610 |
| 2018 | $7,010 | $216,010 | $50,400 | $165,610 |
| 2017 | $6,903 | $218,810 | $53,200 | $165,610 |
| 2016 | $6,707 | $212,590 | $53,200 | $159,390 |
| 2015 | $6,707 | $212,590 | $53,200 | $159,390 |
| 2014 | $6,814 | $212,590 | $53,200 | $159,390 |
Source: Public Records
Map
Nearby Homes
- 3 Stoddard Rd
- 166 Beach Ave
- 44 Meadow View Rd
- 2 Old Town Hwy Unit 39
- 280 Marion St
- 560 Silver Sands Rd Unit 403
- 119 Cove St
- 372 Cosey Beach Ave
- 114 Cove St
- 86 Cove St
- 16 Catherine St
- 60 Townsend Ave
- 50 Concord St
- 266 Cosey Beach Ave
- 262 & 264 Cosey Beach Ave
- 75 Townsend Ave
- 77 Concord St
- 384 Silver Sands Rd
- 380 Silver Sands Rd
- 60 Coleman St Unit 15