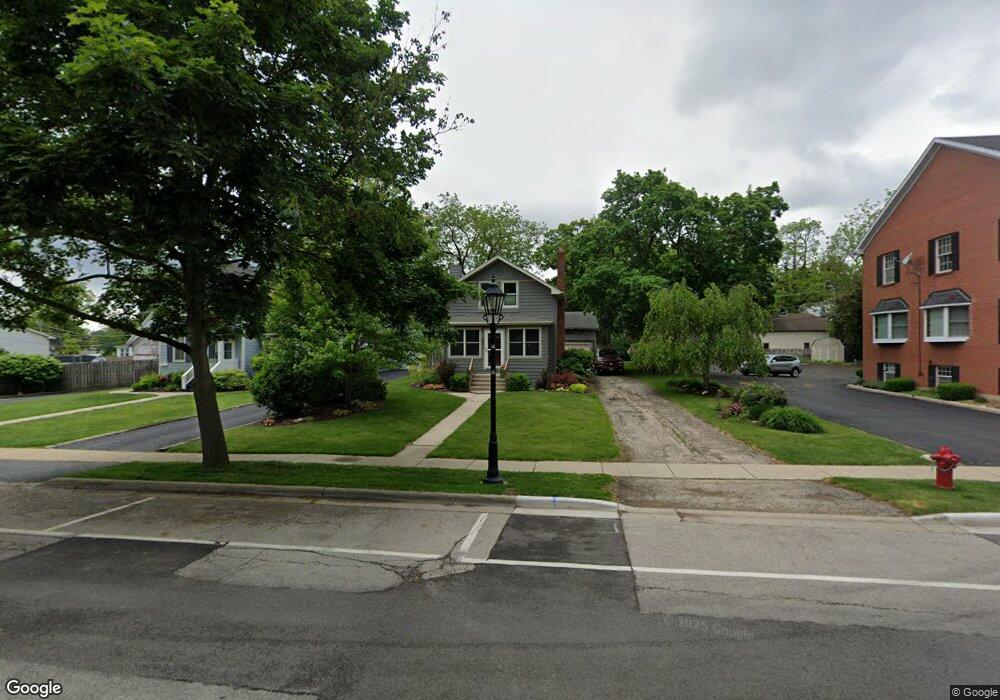
118 S Oak Ave Bartlett, IL 60103
Estimated Value: $335,521 - $376,000
3
Beds
2
Baths
1,240
Sq Ft
$287/Sq Ft
Est. Value
About This Home
This home is located at 118 S Oak Ave, Bartlett, IL 60103 and is currently estimated at $356,380, approximately $287 per square foot. 118 S Oak Ave is a home located in Cook County with nearby schools including Bartlett Elementary School, Eastview Middle School, and South Elgin High School.
Ownership History
Date
Name
Owned For
Owner Type
Purchase Details
Closed on
Feb 4, 2026
Sold by
Group K Properties Llc
Bought by
South Oak Center Llc
Current Estimated Value
Home Financials for this Owner
Home Financials are based on the most recent Mortgage that was taken out on this home.
Original Mortgage
$648,900
Outstanding Balance
$648,274
Interest Rate
6.16%
Mortgage Type
Construction
Estimated Equity
-$291,894
Purchase Details
Closed on
May 15, 2008
Sold by
Katsis John and Katsis Joan
Bought by
Group K Properties Llc Bartlett Professi
Purchase Details
Closed on
Dec 13, 2003
Sold by
Sommers Debra L
Bought by
Sommers Mark R
Home Financials for this Owner
Home Financials are based on the most recent Mortgage that was taken out on this home.
Original Mortgage
$126,400
Interest Rate
5.88%
Mortgage Type
New Conventional
Create a Home Valuation Report for This Property
The Home Valuation Report is an in-depth analysis detailing your home's value as well as a comparison with similar homes in the area
Home Values in the Area
Average Home Value in this Area
Purchase History
| Date | Buyer | Sale Price | Title Company |
|---|---|---|---|
| South Oak Center Llc | $550,000 | None Listed On Document | |
| Group K Properties Llc Bartlett Professi | -- | None Available | |
| Sommers Mark R | -- | World Title Guaranty Inc |
Source: Public Records
Mortgage History
| Date | Status | Borrower | Loan Amount |
|---|---|---|---|
| Open | South Oak Center Llc | $648,900 | |
| Previous Owner | Sommers Mark R | $126,400 |
Source: Public Records
Tax History
| Year | Tax Paid | Tax Assessment Tax Assessment Total Assessment is a certain percentage of the fair market value that is determined by local assessors to be the total taxable value of land and additions on the property. | Land | Improvement |
|---|---|---|---|---|
| 2025 | $6,626 | $27,001 | $9,818 | $17,183 |
| 2024 | $6,626 | $24,249 | $7,013 | $17,236 |
| 2023 | $6,370 | $24,249 | $7,013 | $17,236 |
| 2022 | $6,370 | $24,249 | $7,013 | $17,236 |
| 2021 | $4,835 | $16,343 | $5,960 | $10,383 |
| 2020 | $4,854 | $16,343 | $5,960 | $10,383 |
| 2019 | $4,897 | $18,363 | $5,960 | $12,403 |
| 2018 | $5,150 | $17,842 | $5,259 | $12,583 |
| 2017 | $5,084 | $17,842 | $5,259 | $12,583 |
| 2016 | $5,036 | $17,842 | $5,259 | $12,583 |
| 2015 | $5,168 | $17,195 | $4,558 | $12,637 |
| 2014 | $5,122 | $17,195 | $4,558 | $12,637 |
| 2013 | $4,905 | $17,195 | $4,558 | $12,637 |
Source: Public Records
Map
Nearby Homes
- 403 W Oneida Ave
- 401 W Oneida Ave
- 138 N Eastern Ave
- 275 E Railroad Ave Unit 101
- 140 N Elroy Ave
- 304 Patricia Ln
- 119 E Railroad Ave
- 238 S Devon Ave
- 194 Robert Ct Unit A
- 334 Marcia Ct Unit C
- 110 N Chase Ave
- 249 Surrey Rd
- 420 Ford Ln
- 195 Mary Ct Unit A
- 195 E Oak Glen Dr
- 318 S Prospect Ave
- 615 Mallard Ct Unit C2
- 370 Wilmington Dr Unit D2
- 303 Newport Ln Unit D2
- 5011 Valley Ln Unit 204
- 120 S Oak Ave
- 110 S Oak Ave Unit 300
- 110 S Oak Ave Unit 301
- 110 S Oak Ave
- 128 S Oak Ave
- 102 S Oak Ave
- 111 S Oak Ave
- 119 S Hickory Ave
- 111 S Hickory Ave
- 223 W North Ave
- 220 W Oneida Ave
- 138 S Oak Ave
- 125 S Hickory Ave
- 121 S Oak Ave
- 109 S Oak Ave
- 101 S Oak Ave
- 143 S Oak Ave
- 227 W North Ave
- 137 S Oak Ave
- 230 W Oneida Ave
Your Personal Tour Guide
Ask me questions while you tour the home.