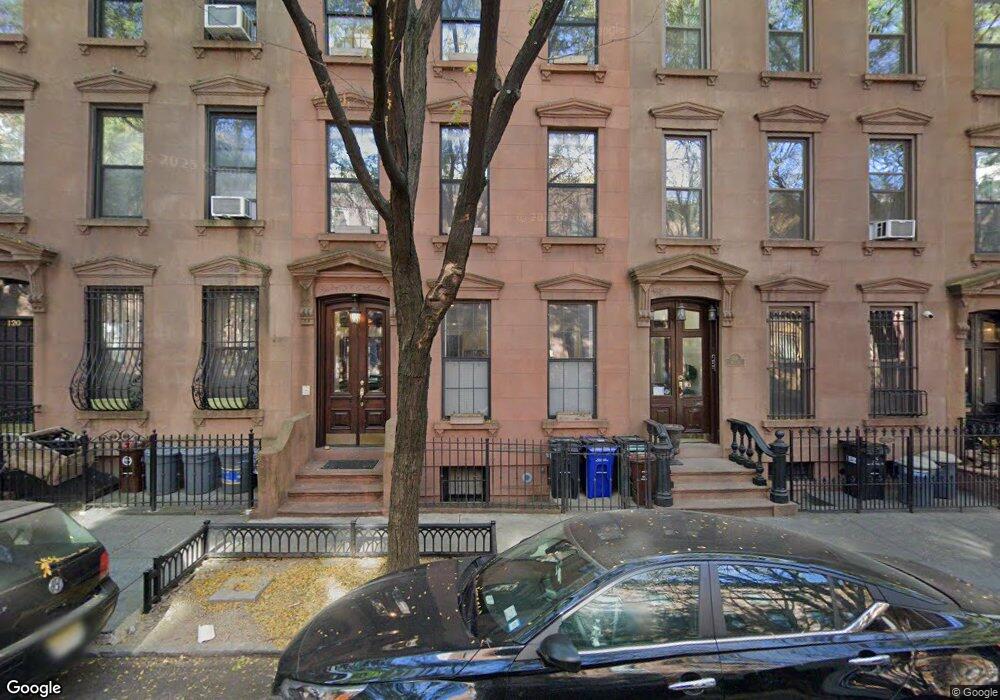
118 Saint Marks Place Unit 3 Brooklyn, NY 11217
Park Slope NeighborhoodEstimated Value: $1,582,000 - $2,335,000
--
Bed
--
Bath
1,246
Sq Ft
$1,542/Sq Ft
Est. Value
About This Home
This home is located at 118 Saint Marks Place Unit 3, Brooklyn, NY 11217 and is currently estimated at $1,921,365, approximately $1,542 per square foot. 118 Saint Marks Place Unit 3 is a home located in Kings County with nearby schools including P.S. 282 Park Slope.
Ownership History
Date
Name
Owned For
Owner Type
Purchase Details
Closed on
Aug 6, 2020
Sold by
Dwyer Kieran Anthony
Bought by
Park Allison Michelle and Allison Michelle Park Living Trust
Current Estimated Value
Purchase Details
Closed on
Sep 26, 2012
Sold by
Suransky Shael
Bought by
Dwyer Kieran Anthony
Home Financials for this Owner
Home Financials are based on the most recent Mortgage that was taken out on this home.
Original Mortgage
$625,000
Interest Rate
3.57%
Mortgage Type
New Conventional
Purchase Details
Closed on
Jul 31, 2007
Sold by
118 St Marks Place Corp
Bought by
Suransky Shael
Home Financials for this Owner
Home Financials are based on the most recent Mortgage that was taken out on this home.
Original Mortgage
$70,000
Interest Rate
6.67%
Create a Home Valuation Report for This Property
The Home Valuation Report is an in-depth analysis detailing your home's value as well as a comparison with similar homes in the area
Home Values in the Area
Average Home Value in this Area
Purchase History
| Date | Buyer | Sale Price | Title Company |
|---|---|---|---|
| Park Allison Michelle | $1,625,000 | -- | |
| Dwyer Kieran Anthony | $1,150,000 | -- | |
| Dwyer Kieran Anthony | $1,150,000 | -- | |
| Suransky Shael | $950,123 | -- | |
| Suransky Shael | $950,123 | -- |
Source: Public Records
Mortgage History
| Date | Status | Borrower | Loan Amount |
|---|---|---|---|
| Previous Owner | Dwyer Kieran Anthony | $625,000 | |
| Previous Owner | Suransky Shael | $70,000 | |
| Previous Owner | Suransky Shael | $760,000 |
Source: Public Records
Tax History Compared to Growth
Tax History
| Year | Tax Paid | Tax Assessment Tax Assessment Total Assessment is a certain percentage of the fair market value that is determined by local assessors to be the total taxable value of land and additions on the property. | Land | Improvement |
|---|---|---|---|---|
| 2025 | $6,608 | $84,926 | $3,266 | $81,660 |
| 2024 | $6,608 | $97,920 | $3,266 | $94,654 |
| 2023 | $6,303 | $113,608 | $3,266 | $110,342 |
| 2022 | $6,196 | $104,734 | $3,266 | $101,468 |
| 2021 | $6,483 | $99,083 | $3,266 | $95,817 |
| 2020 | $3,040 | $92,413 | $3,266 | $89,147 |
| 2019 | $5,735 | $97,264 | $3,266 | $93,998 |
| 2018 | $5,272 | $25,864 | $983 | $24,881 |
| 2017 | $5,272 | $25,864 | $1,060 | $24,804 |
| 2016 | $5,132 | $25,670 | $1,421 | $24,249 |
| 2015 | $2,723 | $24,217 | $1,668 | $22,549 |
| 2014 | $2,723 | $22,847 | $1,888 | $20,959 |
Source: Public Records
Map
Nearby Homes
- 647 Baltic St
- 643 Baltic St Unit TWO
- 641A Baltic St
- 382 Bergen St Unit 2
- 659 Baltic St Unit 3
- 409 Bergen St Unit 2
- 17 Prospect Place Unit 6
- 11 Park Place Unit 4
- 101 4th Ave Unit 2R
- 668 Baltic St Unit 1
- 613 Baltic St Unit 5B
- 613 Baltic St Unit 3C
- 613 Baltic St Unit 5D
- 58 St Marks Place Unit 212
- 58 St Marks Place Unit 206
- 58 St Marks Place Unit 407
- 55 4th Ave
- 58 Saint Marks Place Unit 608
- 116 4th Ave
- 601 Baltic St Unit 4 B
- 118 Saint Marks Place Unit 2
- 118 Saint Marks Place Unit 1
- 118 Saint Marks Place
- 116 Saint Marks Place
- 120 Saint Marks Place
- 120 Saint Marks Place Unit 2
- 118 St Marks Place Unit 3
- 118 St Marks Place Unit 1
- 114 Saint Marks Place Unit 4
- 114 Saint Marks Place Unit 2
- 114 Saint Marks Place Unit 3
- 122 Saint Marks Place
- 122 Saint Marks Place Unit 1
- 122 Saint Marks Place Unit 2
- 122 Saint Marks Place Unit 20
- 124 Saint Marks Place
- 112 Saint Marks Place
- 112 Saint Marks Place Unit 2
- 112 Saint Marks Place Unit 3
- 112 Saint Marks Place Unit 1