
Seller's Agent in 2024
Ishanna Codd
RE/MAX
1 in this area
6 Total Sales
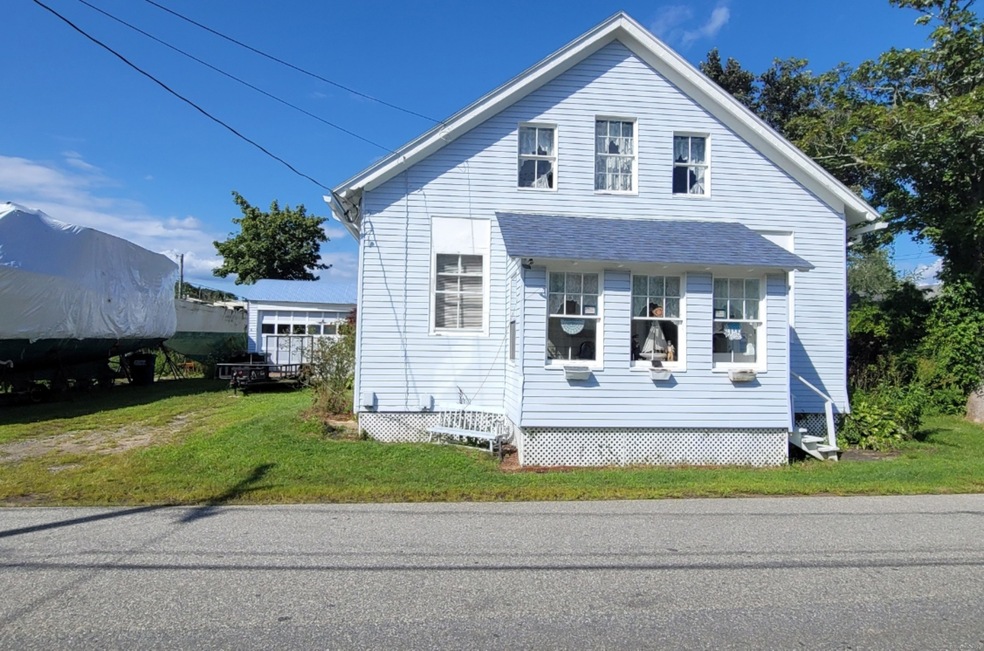
Estimated Value: $393,448 - $491,000
Charming property in the desirable Willow Point Community. Just steps away from the Mystic Shipyard with access to boat launch. This 2-3 bedroom 1 bathroom home features a living room, den/office and formal dining room. Home has walk up attic stairs to a space with natural lighting and room for expansion. Welcoming you into the home is an enclosed front porch. Exceptional opportunity to build a kitchen with your own personal style in mind.
Last Buyer's Agent
Assist 2 Sell/Stebbins Buyer & Sellers Realty License #REB.0795603
| Date | Buyer | Sale Price | Title Company |
|---|---|---|---|
| Boatyard House Llc | -- | None Available | |
| Boatyard House Llc | -- | None Available |
| Date | Event | Price | List to Sale | Price per Sq Ft |
|---|---|---|---|---|
| 11/01/2024 11/01/24 | Sold | $350,000 | 0.0% | $149 / Sq Ft |
| 09/06/2024 09/06/24 | Pending | -- | -- | -- |
| 08/27/2024 08/27/24 | For Sale | $350,000 | -- | $149 / Sq Ft |
| Year | Tax Paid | Tax Assessment Tax Assessment Total Assessment is a certain percentage of the fair market value that is determined by local assessors to be the total taxable value of land and additions on the property. | Land | Improvement |
|---|---|---|---|---|
| 2025 | $5,810 | $213,430 | $129,101 | $84,329 |
| 2024 | $5,397 | $213,430 | $129,101 | $84,329 |
| 2023 | $5,188 | $213,430 | $92,960 | $120,470 |
| 2022 | $5,074 | $213,430 | $92,960 | $120,470 |
| 2021 | $3,597 | $127,680 | $74,410 | $53,270 |
| 2020 | $3,567 | $127,680 | $74,410 | $53,270 |
| 2019 | $3,413 | $127,680 | $74,410 | $53,270 |
| 2018 | $3,372 | $127,680 | $74,410 | $53,270 |
| 2017 | $3,309 | $127,680 | $74,410 | $53,270 |
| 2016 | $3,539 | $147,210 | $98,630 | $48,580 |
| 2015 | $3,421 | $147,210 | $98,630 | $48,580 |
| 2014 | $3,340 | $147,210 | $98,630 | $48,580 |
Seller's Agent in 2024
Ishanna Codd
RE/MAX
1 in this area
6 Total Sales
Buyer's Agent in 2024
Justin Stebbins
Assist 2 Sell/Stebbins Buyer & Sellers Realty
(860) 908-9007
6 in this area
69 Total Sales
Source: SmartMLS
MLS Number: 24041634
APN: GROT-002618-001027-005310
Disclaimer: Certain information contained herein is derived from information provided by parties other than Homes.com. All information provided is deemed reliable, but is not guaranteed to be accurate and should be independently verified.
![]() IDX information is provided exclusively for personal, non-commercial use, and may not be used for any purpose other than to identify prospective properties consumers may be interested in purchasing. Information is deemed reliable but not guaranteed.
IDX information is provided exclusively for personal, non-commercial use, and may not be used for any purpose other than to identify prospective properties consumers may be interested in purchasing. Information is deemed reliable but not guaranteed.
Ask me questions while you tour the home.