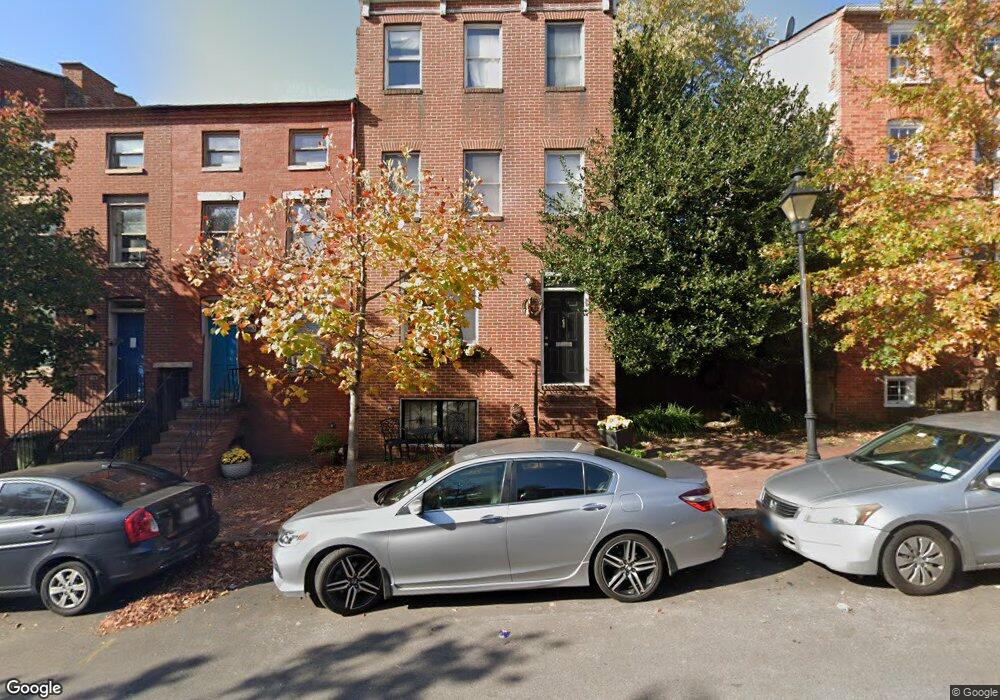
118 Scott St Baltimore, MD 21201
Hollins Market NeighborhoodEstimated Value: $245,000 - $256,916
Studio
4
Baths
1,944
Sq Ft
$129/Sq Ft
Est. Value
About This Home
This home is located at 118 Scott St, Baltimore, MD 21201 and is currently estimated at $250,958, approximately $129 per square foot. 118 Scott St is a home located in Baltimore City with nearby schools including James McHenry Elementary School, Booker T. Washington Middle School, and Digital Harbor High School.
Ownership History
Date
Name
Owned For
Owner Type
Purchase Details
Closed on
Dec 18, 2024
Sold by
Wilt Gregory A and Wilt Allen E
Bought by
Inegbenosun Henry
Current Estimated Value
Home Financials for this Owner
Home Financials are based on the most recent Mortgage that was taken out on this home.
Original Mortgage
$227,000
Outstanding Balance
$225,222
Interest Rate
6.81%
Mortgage Type
New Conventional
Estimated Equity
$25,736
Purchase Details
Closed on
Jun 8, 2023
Sold by
Holloway Melanie L
Bought by
Wilt D Gregory A
Purchase Details
Closed on
Jun 27, 1994
Sold by
Elder D H
Bought by
Wilt Gregory A
Home Financials for this Owner
Home Financials are based on the most recent Mortgage that was taken out on this home.
Original Mortgage
$108,300
Interest Rate
8.74%
Create a Home Valuation Report for This Property
The Home Valuation Report is an in-depth analysis detailing your home's value as well as a comparison with similar homes in the area
Home Values in the Area
Average Home Value in this Area
Purchase History
| Date | Buyer | Sale Price | Title Company |
|---|---|---|---|
| Inegbenosun Henry | $227,000 | Universal Title | |
| Inegbenosun Henry | $227,000 | Universal Title | |
| Wilt D Gregory A | $145,000 | None Listed On Document | |
| Wilt Gregory A | $114,000 | -- |
Source: Public Records
Mortgage History
| Date | Status | Borrower | Loan Amount |
|---|---|---|---|
| Open | Inegbenosun Henry | $227,000 | |
| Closed | Inegbenosun Henry | $227,000 | |
| Previous Owner | Wilt Gregory A | $108,300 | |
| Closed | Wilt Gregory A | $5,000 |
Source: Public Records
Tax History
| Year | Tax Paid | Tax Assessment Tax Assessment Total Assessment is a certain percentage of the fair market value that is determined by local assessors to be the total taxable value of land and additions on the property. | Land | Improvement |
|---|---|---|---|---|
| 2025 | $4,211 | $179,300 | $60,000 | $119,300 |
| 2024 | $4,211 | $179,300 | $60,000 | $119,300 |
| 2023 | $4,548 | $192,700 | $60,000 | $132,700 |
| 2022 | $4,468 | $189,333 | $0 | $0 |
| 2021 | $4,389 | $185,967 | $0 | $0 |
| 2020 | $4,309 | $182,600 | $60,000 | $122,600 |
| 2019 | $4,240 | $180,533 | $0 | $0 |
| 2018 | $4,212 | $178,467 | $0 | $0 |
| 2017 | $4,163 | $176,400 | $0 | $0 |
| 2016 | $4,527 | $176,400 | $0 | $0 |
| 2015 | $4,527 | $176,400 | $0 | $0 |
| 2014 | $4,527 | $182,500 | $0 | $0 |
Source: Public Records
Map
Nearby Homes
- 851 Lemmon St
- 835 1/2 W Lombard St
- 121 Parkin St
- 864 Lemmon St
- 739 Mchenry St
- 229 S Fremont Ave
- 337 Scott St
- 311 S Fremont Ave
- 876 Ryan St
- 209 Penn St
- 831 Ramsay St
- 327 S Fremont Ave
- 649 Dover St
- 322 S Poppleton St
- 659 Portland St
- 640 Dover St
- 884 Washington Blvd
- 130 S Schroeder St
- 1002 W Lombard St
- 803 Washington Blvd
Your Personal Tour Guide
Ask me questions while you tour the home.