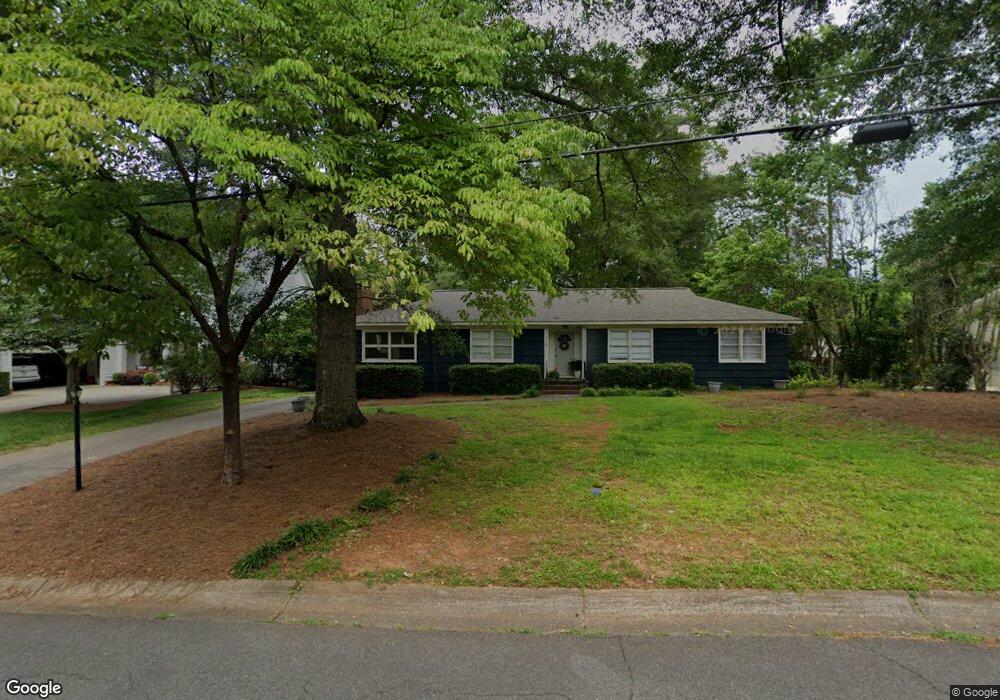
118 Spring Dr Unit 1 Roswell, GA 30075
Estimated Value: $510,000 - $630,174
3
Beds
2
Baths
1,722
Sq Ft
$325/Sq Ft
Est. Value
About This Home
This home is located at 118 Spring Dr Unit 1, Roswell, GA 30075 and is currently estimated at $559,294, approximately $324 per square foot. 118 Spring Dr Unit 1 is a home located in Fulton County with nearby schools including Roswell North Elementary School, Crabapple Middle School, and Roswell High School.
Ownership History
Date
Name
Owned For
Owner Type
Purchase Details
Closed on
Mar 28, 2024
Sold by
Hagewood David Clayton
Bought by
Spring Drive House Llc
Current Estimated Value
Purchase Details
Closed on
Apr 26, 2013
Sold by
Deuel Matthew S
Bought by
Hagewood David Clayton and Hagewood Monica Battell
Home Financials for this Owner
Home Financials are based on the most recent Mortgage that was taken out on this home.
Original Mortgage
$152,800
Interest Rate
3.59%
Mortgage Type
New Conventional
Purchase Details
Closed on
Oct 26, 2001
Sold by
Hussley Sandra M
Bought by
Deuel Matthew S and Deuel George T
Home Financials for this Owner
Home Financials are based on the most recent Mortgage that was taken out on this home.
Original Mortgage
$178,626
Interest Rate
6.74%
Mortgage Type
New Conventional
Purchase Details
Closed on
Jan 4, 1999
Sold by
Irvin Robert A
Bought by
Hussey Sandra M
Home Financials for this Owner
Home Financials are based on the most recent Mortgage that was taken out on this home.
Original Mortgage
$113,400
Interest Rate
6.77%
Mortgage Type
New Conventional
Create a Home Valuation Report for This Property
The Home Valuation Report is an in-depth analysis detailing your home's value as well as a comparison with similar homes in the area
Home Values in the Area
Average Home Value in this Area
Purchase History
| Date | Buyer | Sale Price | Title Company |
|---|---|---|---|
| Spring Drive House Llc | -- | -- | |
| Hagewood David Clayton | $191,000 | -- | |
| Deuel Matthew S | $185,300 | -- | |
| Hussey Sandra M | $162,000 | -- |
Source: Public Records
Mortgage History
| Date | Status | Borrower | Loan Amount |
|---|---|---|---|
| Previous Owner | Hagewood David Clayton | $152,800 | |
| Previous Owner | Deuel Matthew S | $178,626 | |
| Previous Owner | Hussey Sandra M | $113,400 |
Source: Public Records
Tax History
| Year | Tax Paid | Tax Assessment Tax Assessment Total Assessment is a certain percentage of the fair market value that is determined by local assessors to be the total taxable value of land and additions on the property. | Land | Improvement |
|---|---|---|---|---|
| 2025 | $1,052 | $186,640 | $88,000 | $98,640 |
| 2023 | $1,052 | $159,440 | $58,400 | $101,040 |
| 2022 | $3,658 | $139,040 | $50,480 | $88,560 |
| 2021 | $4,339 | $136,240 | $25,000 | $111,240 |
| 2020 | $4,176 | $127,520 | $24,160 | $103,360 |
| 2019 | $559 | $112,760 | $19,520 | $93,240 |
| 2018 | $3,108 | $110,120 | $19,040 | $91,080 |
| 2017 | $1,937 | $66,400 | $15,720 | $50,680 |
| 2016 | $1,938 | $66,400 | $15,720 | $50,680 |
| 2015 | $2,308 | $66,400 | $15,720 | $50,680 |
| 2014 | $1,645 | $66,400 | $15,720 | $50,680 |
Source: Public Records
Map
Nearby Homes
- 102 King St
- 383 Westside Dr Unit 13
- 383 Westside Dr
- 372 Chattahoochee St
- 93 Skyland Dr
- 530 Neel Reid Dr
- 570 Neel Reid Dr
- 49 Sloan St
- 288 Jones Dr
- 69 Maple St
- 217 Skyland Dr
- 420 Longleaf Dr
- 505 Periwinkle Dr
- 9760 Loblolly Ln
- 509 River Mill Cir
- 605 Marietta Hwy
- 164 Oxbo Rd
- 528 Warm Springs Cir
- 216 River Mill Cir
- 320 Wickerberry Ln
Your Personal Tour Guide
Ask me questions while you tour the home.