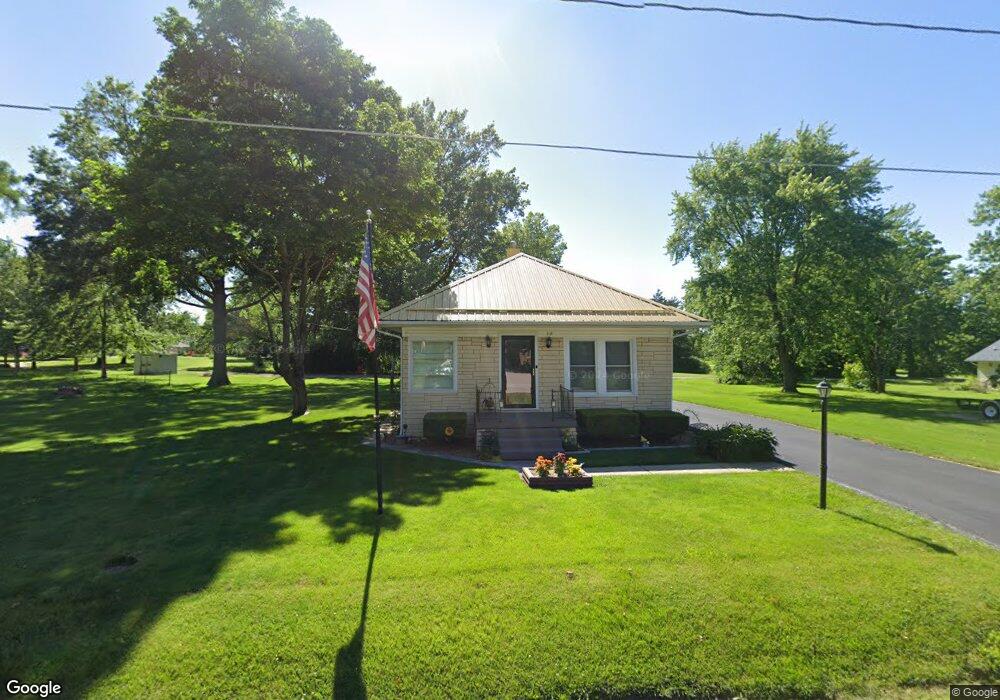
118 Stevens St Nokomis, IL 62075
Estimated Value: $62,779 - $100,000
--
Bed
--
Bath
--
Sq Ft
0.38
Acres
About This Home
This home is located at 118 Stevens St, Nokomis, IL 62075 and is currently estimated at $75,695. 118 Stevens St is a home located in Montgomery County with nearby schools including North Elementary School, Nokomis Junior/Senior High School, and St. Louis Catholic School.
Ownership History
Date
Name
Owned For
Owner Type
Purchase Details
Closed on
Jul 15, 2025
Sold by
Hard Kristi Jo
Bought by
Hard Alan B
Current Estimated Value
Purchase Details
Closed on
Feb 12, 2016
Sold by
Hard Alan B and Hard Kristi Jo
Bought by
Hard Alan B and Hard Kristi Jo
Purchase Details
Closed on
Nov 23, 2011
Sold by
Mills Brett W
Bought by
Hard Alan B
Home Financials for this Owner
Home Financials are based on the most recent Mortgage that was taken out on this home.
Original Mortgage
$31,500
Interest Rate
4.08%
Mortgage Type
Purchase Money Mortgage
Purchase Details
Closed on
Jan 16, 2009
Sold by
Miskell Dolores
Bought by
Mills Brett W
Home Financials for this Owner
Home Financials are based on the most recent Mortgage that was taken out on this home.
Original Mortgage
$26,000
Interest Rate
4.83%
Mortgage Type
Future Advance Clause Open End Mortgage
Purchase Details
Closed on
Jun 17, 2008
Sold by
Miskell James B
Bought by
Miskell Dolores A
Create a Home Valuation Report for This Property
The Home Valuation Report is an in-depth analysis detailing your home's value as well as a comparison with similar homes in the area
Home Values in the Area
Average Home Value in this Area
Purchase History
| Date | Buyer | Sale Price | Title Company |
|---|---|---|---|
| Hard Alan B | -- | None Available | |
| Hard Alan B | -- | -- | |
| Hard Alan B | $35,000 | None Available | |
| Mills Brett W | $26,000 | None Available | |
| Miskell Dolores A | -- | None Available |
Source: Public Records
Mortgage History
| Date | Status | Borrower | Loan Amount |
|---|---|---|---|
| Previous Owner | Hard Alan B | $31,500 | |
| Previous Owner | Mills Brett W | $26,000 |
Source: Public Records
Tax History Compared to Growth
Tax History
| Year | Tax Paid | Tax Assessment Tax Assessment Total Assessment is a certain percentage of the fair market value that is determined by local assessors to be the total taxable value of land and additions on the property. | Land | Improvement |
|---|---|---|---|---|
| 2024 | $911 | $18,470 | $2,110 | $16,360 |
| 2023 | $819 | $17,321 | $1,980 | $15,341 |
| 2022 | $471 | $13,250 | $1,900 | $11,350 |
| 2021 | $517 | $13,850 | $1,990 | $11,860 |
| 2020 | $463 | $13,200 | $1,890 | $11,310 |
| 2019 | $525 | $13,940 | $2,000 | $11,940 |
| 2018 | $650 | $13,120 | $1,880 | $11,240 |
| 2017 | $592 | $12,340 | $1,770 | $10,570 |
| 2016 | $585 | $12,000 | $1,720 | $10,280 |
| 2015 | $574 | $11,630 | $1,670 | $9,960 |
| 2013 | $545 | $11,770 | $1,690 | $10,080 |
Source: Public Records
Map
Nearby Homes