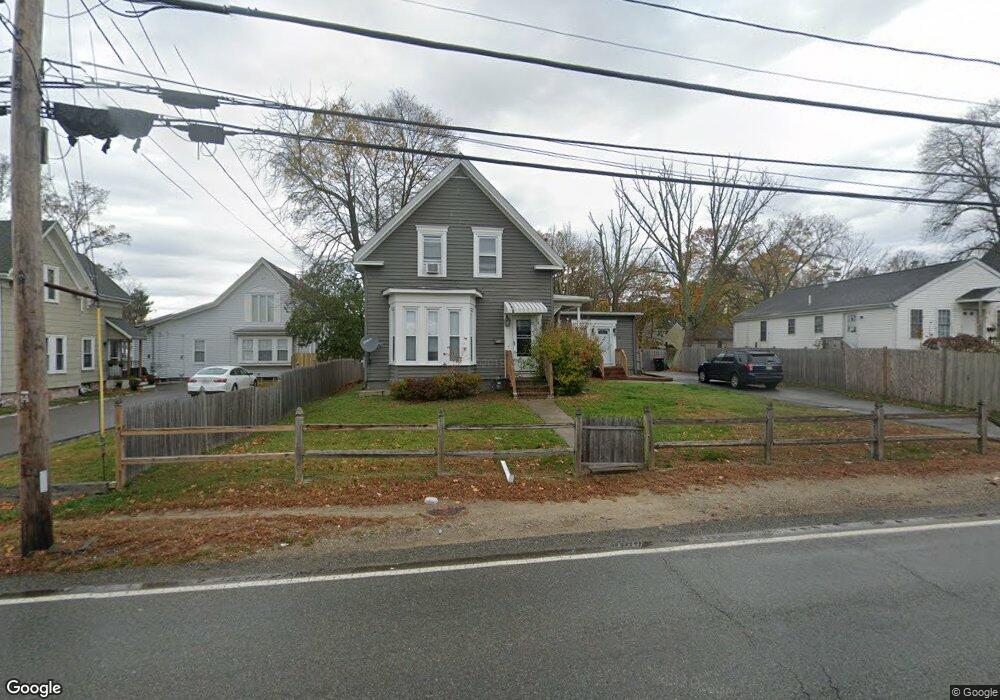
118 Summer St Unit 1 Brockton, MA 02302
Estimated Value: $510,000 - $537,000
4
Beds
2
Baths
1,468
Sq Ft
$356/Sq Ft
Est. Value
About This Home
This home is located at 118 Summer St Unit 1, Brockton, MA 02302 and is currently estimated at $522,662, approximately $356 per square foot. 118 Summer St Unit 1 is a home located in Plymouth County with nearby schools including Brookfield Elementary School, Downey Elementary School, and Ashfield Middle School.
Ownership History
Date
Name
Owned For
Owner Type
Purchase Details
Closed on
Jun 13, 2025
Sold by
Millien Christlhaine and Juste Zachary
Bought by
Silva Jose M
Current Estimated Value
Home Financials for this Owner
Home Financials are based on the most recent Mortgage that was taken out on this home.
Original Mortgage
$498,750
Outstanding Balance
$496,583
Interest Rate
6.76%
Mortgage Type
Purchase Money Mortgage
Estimated Equity
$26,079
Purchase Details
Closed on
Jan 16, 2024
Sold by
Lsf9 Master Part T and United States Bk T N A Tr
Bought by
Millien Christlaine and Juste Zachary
Home Financials for this Owner
Home Financials are based on the most recent Mortgage that was taken out on this home.
Original Mortgage
$456,577
Interest Rate
7.22%
Mortgage Type
FHA
Purchase Details
Closed on
Sep 11, 2003
Sold by
Summer Dunn Rt and Dunn
Bought by
Cook Ryan M
Home Financials for this Owner
Home Financials are based on the most recent Mortgage that was taken out on this home.
Original Mortgage
$255,424
Interest Rate
6.22%
Mortgage Type
Purchase Money Mortgage
Purchase Details
Closed on
Oct 27, 1995
Sold by
Fhlmc
Bought by
Dunn Paul M
Purchase Details
Closed on
Oct 6, 1994
Sold by
Lewis Vaughn L and Lewis Jennifer A
Bought by
Fhlmc
Purchase Details
Closed on
Jan 2, 1987
Sold by
Carvalho David J
Bought by
Lewis Vaughn L
Create a Home Valuation Report for This Property
The Home Valuation Report is an in-depth analysis detailing your home's value as well as a comparison with similar homes in the area
Home Values in the Area
Average Home Value in this Area
Purchase History
| Date | Buyer | Sale Price | Title Company |
|---|---|---|---|
| Silva Jose M | $525,000 | None Available | |
| Silva Jose M | $525,000 | None Available | |
| Millien Christlaine | $465,000 | None Available | |
| Millien Christlaine | $465,000 | None Available | |
| Cook Ryan M | $257,500 | -- | |
| Cook Ryan M | $257,500 | -- | |
| Dunn Paul M | $30,000 | -- | |
| Dunn Paul M | $30,000 | -- | |
| Fhlmc | $75,000 | -- | |
| Fhlmc | $75,000 | -- | |
| Lewis Vaughn L | $109,900 | -- |
Source: Public Records
Mortgage History
| Date | Status | Borrower | Loan Amount |
|---|---|---|---|
| Open | Silva Jose M | $498,750 | |
| Closed | Silva Jose M | $498,750 | |
| Previous Owner | Millien Christlaine | $456,577 | |
| Previous Owner | Lewis Vaughn L | $255,424 |
Source: Public Records
Tax History Compared to Growth
Tax History
| Year | Tax Paid | Tax Assessment Tax Assessment Total Assessment is a certain percentage of the fair market value that is determined by local assessors to be the total taxable value of land and additions on the property. | Land | Improvement |
|---|---|---|---|---|
| 2025 | $4,917 | $406,000 | $159,000 | $247,000 |
| 2024 | $4,645 | $386,400 | $159,000 | $227,400 |
| 2023 | $4,280 | $329,700 | $109,200 | $220,500 |
| 2022 | $4,085 | $292,400 | $99,200 | $193,200 |
| 2021 | $3,928 | $270,900 | $91,800 | $179,100 |
| 2020 | $3,948 | $260,600 | $80,700 | $179,900 |
| 2019 | $3,907 | $251,400 | $76,900 | $174,500 |
| 2018 | $4,681 | $229,700 | $76,900 | $152,800 |
| 2017 | $3,181 | $197,600 | $76,900 | $120,700 |
| 2016 | $2,977 | $171,500 | $73,300 | $98,200 |
| 2015 | $2,543 | $140,100 | $73,300 | $66,800 |
| 2014 | $2,538 | $140,000 | $73,300 | $66,700 |
Source: Public Records
Map
Nearby Homes