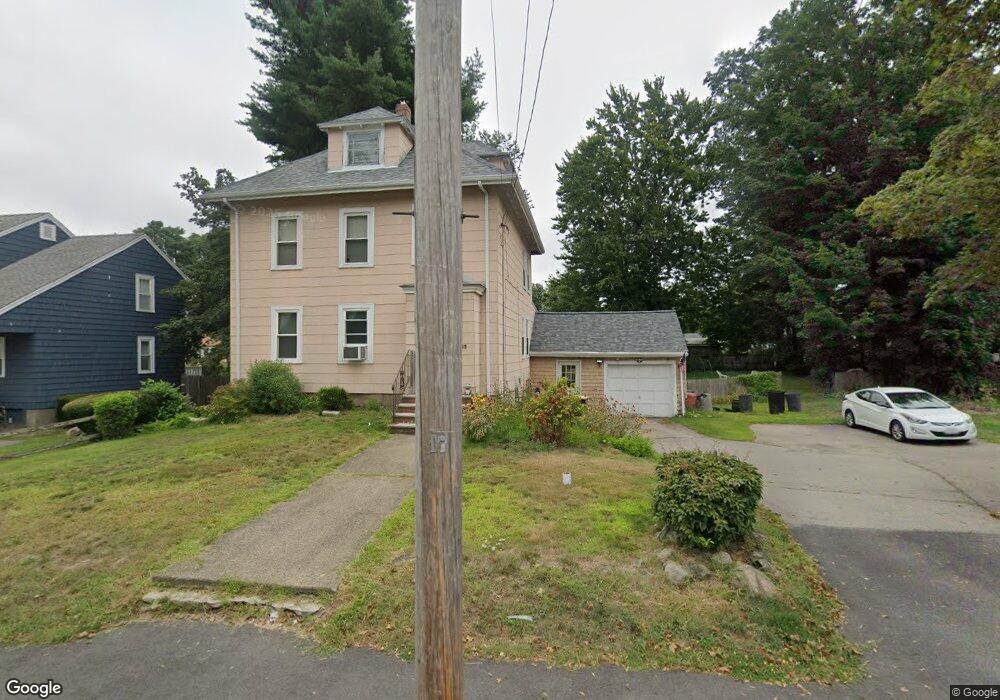
118 Summer St Weymouth, MA 02188
Weymouth Landing NeighborhoodEstimated Value: $545,000 - $616,000
3
Beds
1
Bath
1,600
Sq Ft
$364/Sq Ft
Est. Value
About This Home
This home is located at 118 Summer St, Weymouth, MA 02188 and is currently estimated at $582,614, approximately $364 per square foot. 118 Summer St is a home located in Norfolk County with nearby schools including Frederick C Murphy, Abigail Adams Middle School, and Weymouth Middle School Chapman.
Ownership History
Date
Name
Owned For
Owner Type
Purchase Details
Closed on
Jul 25, 1997
Sold by
Piepiora Paul C
Bought by
Avitabile Alexander P and Avitabile Helen F
Current Estimated Value
Home Financials for this Owner
Home Financials are based on the most recent Mortgage that was taken out on this home.
Original Mortgage
$80,000
Outstanding Balance
$12,160
Interest Rate
7.7%
Mortgage Type
Purchase Money Mortgage
Estimated Equity
$570,454
Create a Home Valuation Report for This Property
The Home Valuation Report is an in-depth analysis detailing your home's value as well as a comparison with similar homes in the area
Home Values in the Area
Average Home Value in this Area
Purchase History
| Date | Buyer | Sale Price | Title Company |
|---|---|---|---|
| Avitabile Alexander P | $100,000 | -- |
Source: Public Records
Mortgage History
| Date | Status | Borrower | Loan Amount |
|---|---|---|---|
| Open | Avitabile Alexander P | $80,000 |
Source: Public Records
Tax History Compared to Growth
Tax History
| Year | Tax Paid | Tax Assessment Tax Assessment Total Assessment is a certain percentage of the fair market value that is determined by local assessors to be the total taxable value of land and additions on the property. | Land | Improvement |
|---|---|---|---|---|
| 2025 | $4,588 | $454,300 | $207,600 | $246,700 |
| 2024 | $4,444 | $432,700 | $197,700 | $235,000 |
| 2023 | $4,155 | $397,600 | $183,100 | $214,500 |
| 2022 | $4,169 | $363,800 | $169,500 | $194,300 |
| 2021 | $3,803 | $323,900 | $169,500 | $154,400 |
| 2020 | $3,723 | $312,300 | $169,500 | $142,800 |
| 2019 | $3,417 | $281,900 | $163,000 | $118,900 |
| 2018 | $3,386 | $270,900 | $155,200 | $115,700 |
| 2017 | $3,317 | $258,900 | $147,900 | $111,000 |
| 2016 | $3,249 | $253,800 | $142,200 | $111,600 |
| 2015 | $3,202 | $248,200 | $142,200 | $106,000 |
| 2014 | $3,120 | $234,600 | $132,300 | $102,300 |
Source: Public Records
Map
Nearby Homes
- 76 Kingman St
- 24 Blake Rd
- 33 Congress St
- 15 Summer St
- 16 Lindbergh Ave
- 23-25 Lindbergh Ave
- 114 Broad St Unit D
- 114 Broad St Unit C
- 19 Vine St Unit 3
- 19 Vine St Unit 1
- 11 Richmond St
- 122 Washington St Unit 22
- 36 Brookside Rd
- 37 Lantern Ln
- 230 Lisle St
- 51 Faxon St
- 97 Liberty St
- 286 Broad St
- 141 Commercial St Unit 9
- 12 Klasson Ln