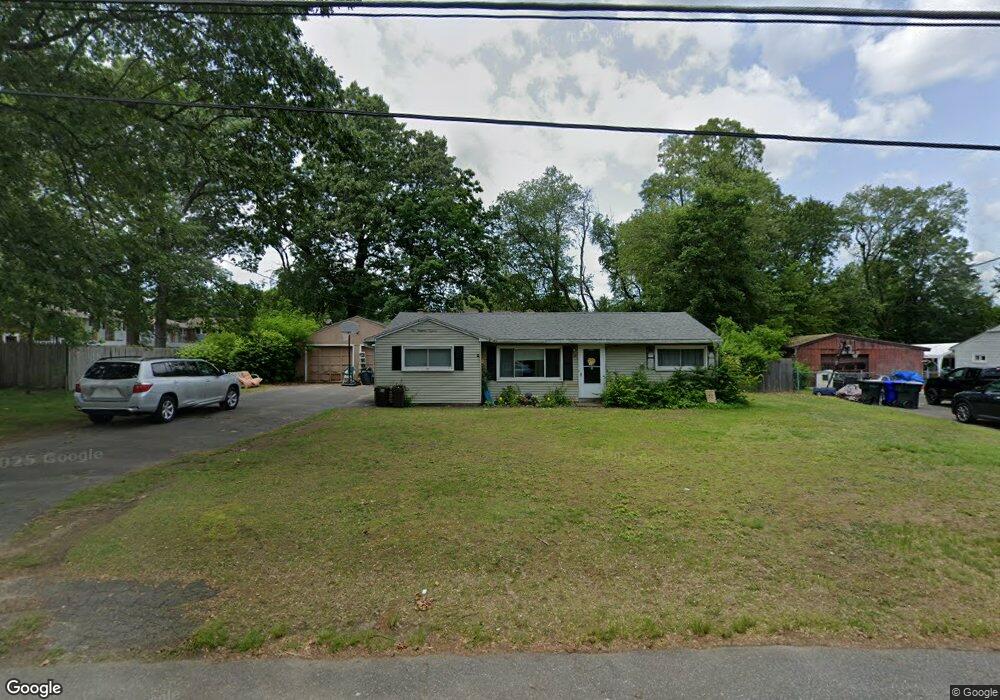
118 Sunridge Dr Springfield, MA 01118
East Forest Park NeighborhoodEstimated Value: $252,000 - $300,000
3
Beds
2
Baths
1,071
Sq Ft
$261/Sq Ft
Est. Value
About This Home
This home is located at 118 Sunridge Dr, Springfield, MA 01118 and is currently estimated at $279,471, approximately $260 per square foot. 118 Sunridge Dr is a home located in Hampden County with nearby schools including Frederick Harris Elementary School, M Marcus Kiley Middle, and Springfield High School of Science and Technology.
Ownership History
Date
Name
Owned For
Owner Type
Purchase Details
Closed on
Feb 12, 2014
Sold by
Connors Marie T
Bought by
Hewlett Michael T and Hewlett Colleen M
Current Estimated Value
Home Financials for this Owner
Home Financials are based on the most recent Mortgage that was taken out on this home.
Original Mortgage
$68,000
Outstanding Balance
$51,742
Interest Rate
4.52%
Mortgage Type
New Conventional
Estimated Equity
$227,729
Create a Home Valuation Report for This Property
The Home Valuation Report is an in-depth analysis detailing your home's value as well as a comparison with similar homes in the area
Home Values in the Area
Average Home Value in this Area
Purchase History
| Date | Buyer | Sale Price | Title Company |
|---|---|---|---|
| Hewlett Michael T | $85,000 | -- |
Source: Public Records
Mortgage History
| Date | Status | Borrower | Loan Amount |
|---|---|---|---|
| Open | Hewlett Michael T | $68,000 |
Source: Public Records
Tax History
| Year | Tax Paid | Tax Assessment Tax Assessment Total Assessment is a certain percentage of the fair market value that is determined by local assessors to be the total taxable value of land and additions on the property. | Land | Improvement |
|---|---|---|---|---|
| 2025 | $2,926 | $186,600 | $60,500 | $126,100 |
| 2024 | $2,958 | $184,200 | $60,500 | $123,700 |
| 2023 | $2,667 | $156,400 | $57,600 | $98,800 |
| 2022 | $3,011 | $160,000 | $57,600 | $102,400 |
| 2021 | $2,584 | $136,700 | $52,300 | $84,400 |
| 2020 | $2,428 | $124,300 | $52,300 | $72,000 |
| 2019 | $2,466 | $125,300 | $52,300 | $73,000 |
| 2018 | $2,289 | $116,300 | $52,300 | $64,000 |
| 2017 | $2,318 | $117,900 | $52,300 | $65,600 |
| 2016 | $2,135 | $108,600 | $52,300 | $56,300 |
| 2015 | $2,115 | $107,500 | $52,300 | $55,200 |
Source: Public Records
Map
Nearby Homes
- 19 Manor Ct Unit 19
- 125 Manor Ct Unit 125
- 55 Allen St
- 49 Corcoran Blvd
- 17 Pebble Mill Rd
- 206 Treetop Ave
- 101 Regal St
- 46 Hadley St
- 119 Powell Ave
- 86 Talmadge Dr
- 47 Hartford Terrace
- 85 Talmadge Dr
- 509 Plumtree Rd
- 24 Wands St
- 647 Plumtree Rd
- 79 Roosevelt Ave
- 116 Carr St
- 37 Chesterfield Ave
- 1088 Sumner Ave
- 13 Bither St
- 128 Sunridge Dr
- 110 Sunridge Dr
- 71 Manor Ct Unit 71
- 41 Manor Ct Unit 41
- 49 Manor Ct Unit 49
- 51 Manor Ct Unit 51
- 43 Manor Ct Unit 43
- 43 Manor Ct
- 69 Manor Ct Unit 69
- 51 Manor Ct
- 61 Manor Ct Unit 61
- 67 Manor Ct
- 49 Manor Ct
- 115 Sunridge Dr
- 75 Manor Ct Unit 75
- 81 Manor Ct Unit 81
- 83 Manor Ct Unit 83
- 100 Sunridge Dr
- 129 Sunridge Dr
- 105 Manor Ct
Your Personal Tour Guide
Ask me questions while you tour the home.