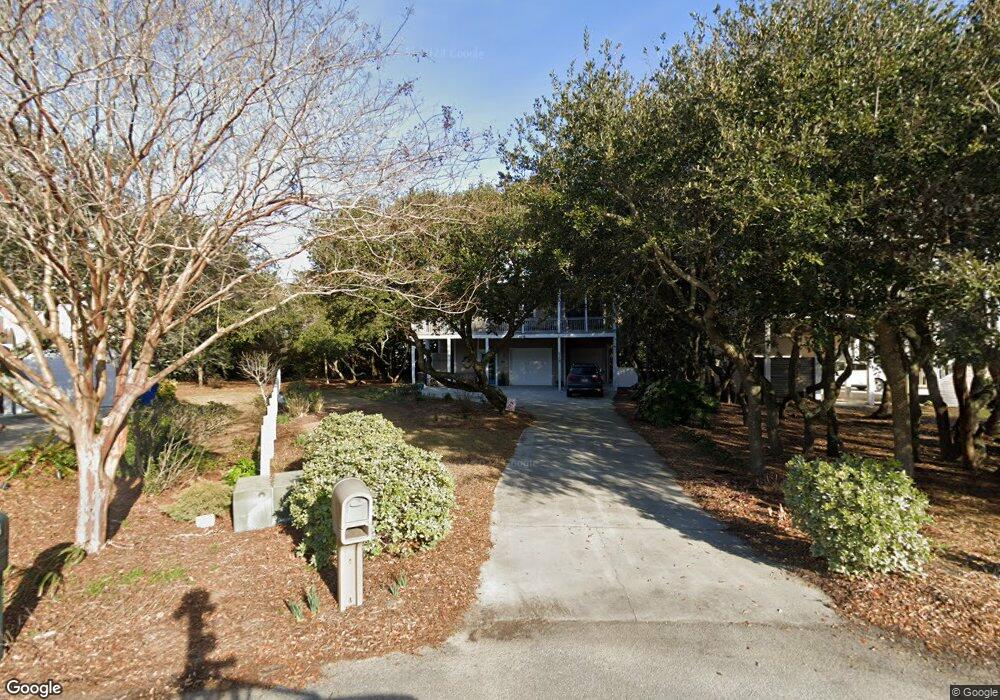
118 Swindell Ln Atlantic Beach, NC 28512
Estimated Value: $822,000 - $1,230,000
3
Beds
4
Baths
2,863
Sq Ft
$351/Sq Ft
Est. Value
About This Home
This home is located at 118 Swindell Ln, Atlantic Beach, NC 28512 and is currently estimated at $1,004,586, approximately $350 per square foot. 118 Swindell Ln is a home located in Carteret County with nearby schools including Morehead City Primary School, Morehead Elementary School at Camp Glenn, and Morehead City Middle School.
Ownership History
Date
Name
Owned For
Owner Type
Purchase Details
Closed on
Oct 26, 2011
Sold by
Pruden William H and Pruden Lillian N
Bought by
Adkins Mark A and Adkins Daryl Joy
Current Estimated Value
Home Financials for this Owner
Home Financials are based on the most recent Mortgage that was taken out on this home.
Original Mortgage
$356,000
Outstanding Balance
$243,577
Interest Rate
4.09%
Mortgage Type
New Conventional
Estimated Equity
$761,009
Purchase Details
Closed on
Jan 22, 2008
Sold by
Barwick James Franklin and Barwick Kathryn P
Bought by
Powell Kenneth R and Powell Susan P
Purchase Details
Closed on
Aug 15, 2007
Sold by
Powell Kenneth R and Powell Susan P
Bought by
Barwick James Franklin and Barwick Kathryn P
Purchase Details
Closed on
Nov 3, 2003
Purchase Details
Closed on
Nov 17, 1999
Create a Home Valuation Report for This Property
The Home Valuation Report is an in-depth analysis detailing your home's value as well as a comparison with similar homes in the area
Home Values in the Area
Average Home Value in this Area
Purchase History
| Date | Buyer | Sale Price | Title Company |
|---|---|---|---|
| Adkins Mark A | $445,000 | None Available | |
| Powell Kenneth R | -- | None Available | |
| Barwick James Franklin | -- | None Available | |
| -- | $345,500 | -- | |
| -- | $75,000 | -- |
Source: Public Records
Mortgage History
| Date | Status | Borrower | Loan Amount |
|---|---|---|---|
| Open | Adkins Mark A | $356,000 |
Source: Public Records
Tax History Compared to Growth
Tax History
| Year | Tax Paid | Tax Assessment Tax Assessment Total Assessment is a certain percentage of the fair market value that is determined by local assessors to be the total taxable value of land and additions on the property. | Land | Improvement |
|---|---|---|---|---|
| 2025 | $2,884 | $1,238,396 | $312,168 | $926,228 |
| 2024 | $1,541 | $424,378 | $136,920 | $287,458 |
| 2023 | $1,458 | $424,378 | $136,920 | $287,458 |
| 2022 | $1,415 | $424,378 | $136,920 | $287,458 |
| 2021 | $1,415 | $424,378 | $136,920 | $287,458 |
| 2020 | $1,415 | $424,378 | $136,920 | $287,458 |
| 2019 | $1,419 | $452,955 | $147,189 | $305,766 |
| 2017 | $1,419 | $452,955 | $147,189 | $305,766 |
| 2016 | $1,387 | $442,621 | $147,189 | $295,432 |
| 2015 | $1,343 | $442,621 | $147,189 | $295,432 |
| 2014 | $1,565 | $516,544 | $195,090 | $321,454 |
Source: Public Records
Map
Nearby Homes
- 101 Bay Ridge Dr
- 221 Sound Side Dr
- 413 W Fort MacOn Rd
- 123 & 125 Coral Bay Ct
- 602 Ft MacOn Rd W Unit 117
- 602 Ft MacOn Rd Unit 132
- 602 Ft MacOn Rd W Unit 231
- 602 W Fort MacOn Rd Unit 118
- 602 W Fort MacOn Rd Unit 242
- 602 W Fort MacOn Rd Unit 135
- 602 W Fort MacOn Rd Unit 204/139
- 602 W Fort MacOn Rd Unit 109
- 602 W Fort MacOn Rd Unit 139
- 602 Fort MacOn Rd
- 602 W Fort MacOn Rd Unit 231
- 2111 W Ft MacOn Rd Unit 251
- 2111 W Fort MacOn Rd Unit 336 Dunescape
- 503 W Bogue Blvd
- 415 W Boardwalk Blvd
- 113 Hoop Pole Creek Dr
- 120 Swindell Ln
- 116 Swindell Ln
- 122 Swindell Ln
- 114 Swindell Ln
- 101 Oak Forest Ln
- 103 Oak Forest Ln
- 112 Swindell Ln
- 105 Sound Side Dr
- 103 Sound Side Dr
- 103 Soundside Dr
- 101 Sound Side Dr
- 107 Sound Side Dr
- 1502 W Fort MacOn Rd
- 100 Oak Forest Ln
- 109 Sound Side Dr
- 103 Bay Ridge Dr
- 111 Sound Side Dr
- 223 Sound Side Dr
- 115 Swindell Ln
- 111 Swindell Ln