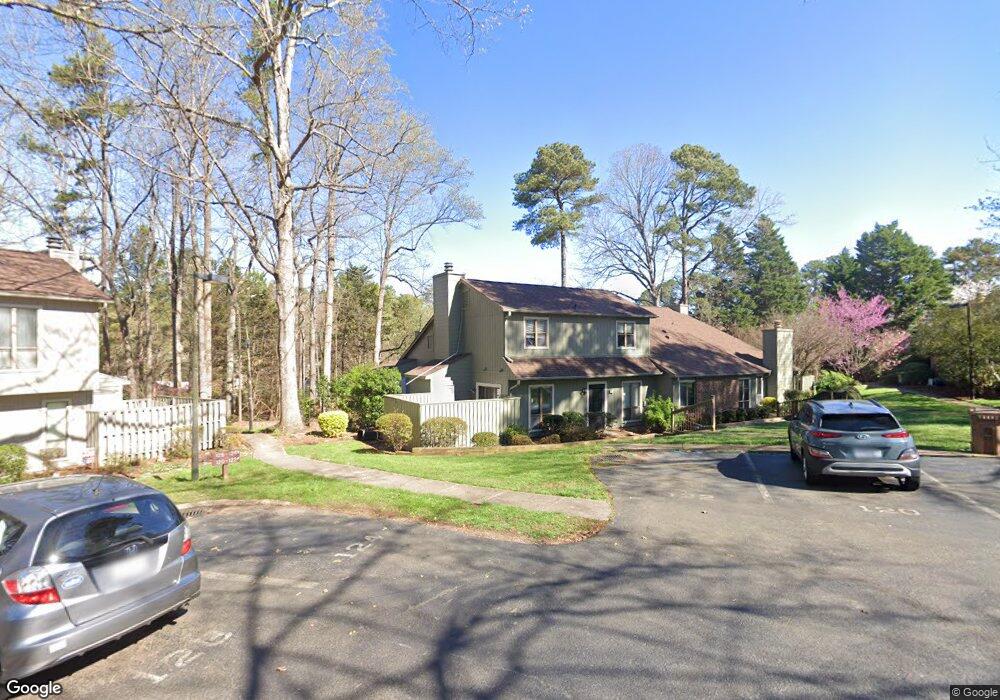
118 Twin Oaks Place Cary, NC 27511
South Cary NeighborhoodEstimated Value: $299,267 - $312,000
2
Beds
3
Baths
1,275
Sq Ft
$239/Sq Ft
Est. Value
About This Home
This home is located at 118 Twin Oaks Place, Cary, NC 27511 and is currently estimated at $304,317, approximately $238 per square foot. 118 Twin Oaks Place is a home located in Wake County with nearby schools including Briarcliff Elementary School, East Cary Middle School, and Cary High School.
Ownership History
Date
Name
Owned For
Owner Type
Purchase Details
Closed on
Nov 24, 2020
Sold by
Ablang Sarah
Bought by
Nc Cary Llc
Current Estimated Value
Purchase Details
Closed on
Mar 23, 2006
Sold by
Carroll Darcey L and Carroll Eadie M
Bought by
Ablang Sarah
Home Financials for this Owner
Home Financials are based on the most recent Mortgage that was taken out on this home.
Original Mortgage
$97,470
Interest Rate
6.19%
Mortgage Type
FHA
Purchase Details
Closed on
Apr 30, 1999
Sold by
Morris Marajean A
Bought by
Carroll Darcey L and Marlowe Eadie E
Home Financials for this Owner
Home Financials are based on the most recent Mortgage that was taken out on this home.
Original Mortgage
$85,360
Interest Rate
7.06%
Create a Home Valuation Report for This Property
The Home Valuation Report is an in-depth analysis detailing your home's value as well as a comparison with similar homes in the area
Home Values in the Area
Average Home Value in this Area
Purchase History
| Date | Buyer | Sale Price | Title Company |
|---|---|---|---|
| Nc Cary Llc | $180,000 | None Available | |
| Nc Cary Llc | $180,000 | None Listed On Document | |
| Ablang Sarah | $99,000 | None Available | |
| Carroll Darcey L | $88,000 | -- |
Source: Public Records
Mortgage History
| Date | Status | Borrower | Loan Amount |
|---|---|---|---|
| Previous Owner | Ablang Sarah | $97,470 | |
| Previous Owner | Carroll Darcey L | $85,360 |
Source: Public Records
Tax History Compared to Growth
Tax History
| Year | Tax Paid | Tax Assessment Tax Assessment Total Assessment is a certain percentage of the fair market value that is determined by local assessors to be the total taxable value of land and additions on the property. | Land | Improvement |
|---|---|---|---|---|
| 2025 | $2,412 | $279,026 | $115,000 | $164,026 |
| 2024 | $2,360 | $279,026 | $115,000 | $164,026 |
| 2023 | $1,636 | $161,269 | $53,000 | $108,269 |
| 2022 | $1,575 | $161,269 | $53,000 | $108,269 |
| 2021 | $1,544 | $161,269 | $53,000 | $108,269 |
| 2020 | $1,552 | $161,269 | $53,000 | $108,269 |
| 2019 | $1,293 | $118,873 | $40,000 | $78,873 |
| 2018 | $1,214 | $118,873 | $40,000 | $78,873 |
| 2017 | $1,167 | $118,873 | $40,000 | $78,873 |
| 2016 | $1,150 | $118,873 | $40,000 | $78,873 |
| 2015 | $979 | $97,432 | $24,000 | $73,432 |
| 2014 | $924 | $97,432 | $24,000 | $73,432 |
Source: Public Records
Map
Nearby Homes
- 124 Twin Oaks Place
- 210 Twin Oaks Place
- 114 Drummond Place
- 135 Drummond Place Unit 7C
- 512 New Kent Place Unit 512
- 104 Eagle Ct
- 102 Climbing Ivy Ct
- 122 Clancy Cir
- 216 Climbing Ivy Ct
- 101 Flora McDonald Ln
- 915 Ball Field Alley Unit 102
- 915 Ball Field Alley Unit 104
- 915 Ball Field Alley Unit 101
- 915 Ball Field Alley Unit 305
- 107 Concannon Ct
- 1312 Hampton Valley Rd
- 119 Hanover Place
- 1305 Hampton Valley Rd
- 151 Lake Pine Dr Unit 1713B
- 148 Carmichael Ct Unit 9C
- 120 Twin Oaks Place
- 116 Twin Oaks Place
- 126 Twin Oaks Place
- 122 Twin Oaks Place
- 112 Twin Oaks Place
- 128 Twin Oaks Place
- 108 Twin Oaks Place
- 114 Twin Oaks Place
- 110 Twin Oaks Place
- 132 Twin Oaks Place
- 104 Twin Oaks Place
- 204 Twin Oaks Place
- 208 Twin Oaks Place
- 106 Twin Oaks Place
- 100 Twin Oaks Place
- 206 Twin Oaks Place
- 102 Twin Oaks Place
- 212 Twin Oaks Place
- 134 Twin Oaks Place
- 202 Twin Oaks Place