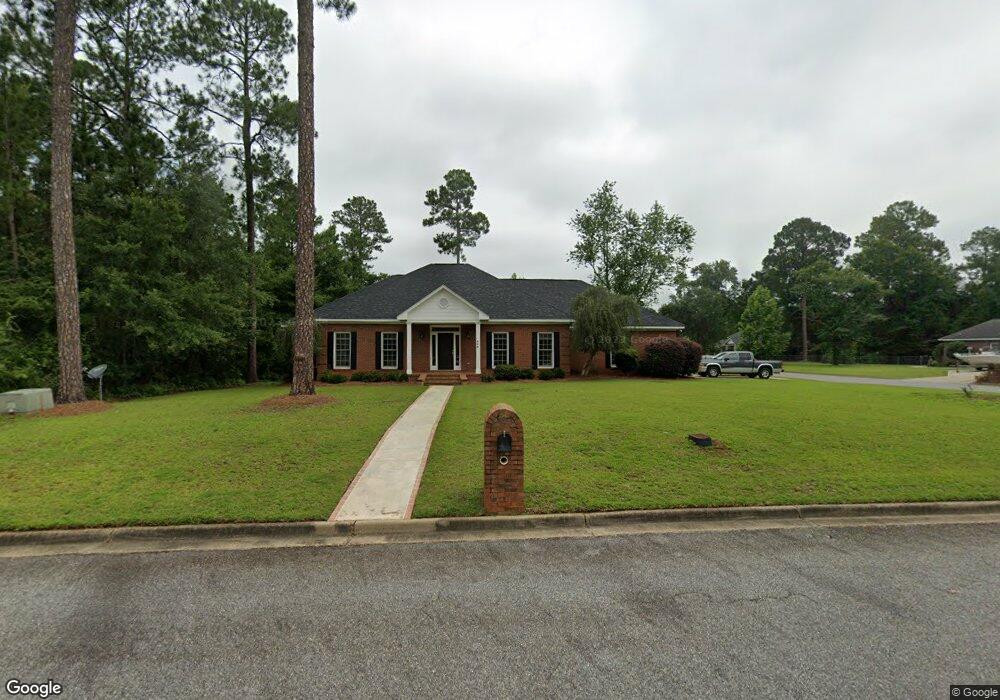
118 Tybee Ln Leesburg, GA 31763
Estimated Value: $357,032 - $378,000
4
Beds
3
Baths
2,331
Sq Ft
$158/Sq Ft
Est. Value
About This Home
This home is located at 118 Tybee Ln, Leesburg, GA 31763 and is currently estimated at $369,008, approximately $158 per square foot. 118 Tybee Ln is a home located in Lee County with nearby schools including Lee County Primary School, Lee County Elementary School, and Lee County Middle School - West Campus.
Ownership History
Date
Name
Owned For
Owner Type
Purchase Details
Closed on
Aug 4, 2023
Sold by
Nolle Kurt David
Bought by
Nolle Patricia A
Current Estimated Value
Home Financials for this Owner
Home Financials are based on the most recent Mortgage that was taken out on this home.
Original Mortgage
$321,789
Outstanding Balance
$314,869
Interest Rate
7.12%
Mortgage Type
FHA
Estimated Equity
$54,139
Purchase Details
Closed on
Feb 26, 2021
Sold by
Un Chi Kong
Bought by
Nolle Patricia
Purchase Details
Closed on
Mar 1, 2004
Sold by
Prudential Relocation
Bought by
Un Chi Kong and Sao Mei Chan
Purchase Details
Closed on
Jan 1, 2004
Sold by
Overoll Daniel and Overoll Cynthia
Bought by
Prudential Relocation
Purchase Details
Closed on
Jun 1, 2000
Sold by
The Marrick Company
Bought by
Overvoll Daniel
Purchase Details
Closed on
Jan 1, 2000
Sold by
Palmyra Dev Llc
Bought by
The Marrick Company
Create a Home Valuation Report for This Property
The Home Valuation Report is an in-depth analysis detailing your home's value as well as a comparison with similar homes in the area
Home Values in the Area
Average Home Value in this Area
Purchase History
| Date | Buyer | Sale Price | Title Company |
|---|---|---|---|
| Nolle Patricia A | -- | -- | |
| Nolle Patricia | $259,500 | -- | |
| Un Chi Kong | -- | -- | |
| Prudential Relocation | -- | -- | |
| Overvoll Daniel | $197,900 | -- | |
| The Marrick Company | $31,000 | -- |
Source: Public Records
Mortgage History
| Date | Status | Borrower | Loan Amount |
|---|---|---|---|
| Open | Nolle Patricia A | $321,789 |
Source: Public Records
Tax History Compared to Growth
Tax History
| Year | Tax Paid | Tax Assessment Tax Assessment Total Assessment is a certain percentage of the fair market value that is determined by local assessors to be the total taxable value of land and additions on the property. | Land | Improvement |
|---|---|---|---|---|
| 2024 | $3,081 | $102,000 | $14,000 | $88,000 |
| 2023 | $2,819 | $102,000 | $14,000 | $88,000 |
| 2022 | $2,819 | $102,000 | $14,000 | $88,000 |
| 2021 | $2,879 | $102,000 | $14,000 | $88,000 |
| 2020 | $2,908 | $86,320 | $13,640 | $72,680 |
| 2019 | $2,908 | $86,320 | $13,640 | $72,680 |
| 2018 | $0 | $86,320 | $13,640 | $72,680 |
| 2017 | $2,780 | $86,320 | $13,640 | $72,680 |
| 2016 | $2,692 | $86,320 | $13,640 | $72,680 |
| 2015 | -- | $78,480 | $12,400 | $66,080 |
| 2014 | $2,464 | $78,480 | $12,400 | $66,080 |
| 2013 | -- | $78,480 | $12,400 | $66,080 |
Source: Public Records
Map
Nearby Homes
- 113 Tybee Ln
- lot 165 Fussell Rd
- 0000 Fussell Rd
- 000 Fussell Rd
- 418 Fussell Rd
- 424 Fussell Rd
- 485 Fussell Rd
- 127 Charlie Ln
- 254 Fussell Rd
- LOT 134 Aspen Dr
- lot 130 Aspen Dr
- 203 Hillridge Dr
- 133 Churchview Dr
- 101 Hillgrove Ln
- 145 Churchview Dr
- 150 Hugh Rd
- 205 Thistledown Dr
- 194 Thistledown Dr
- 140 Belmont Dr
- 137 Chicory Ct