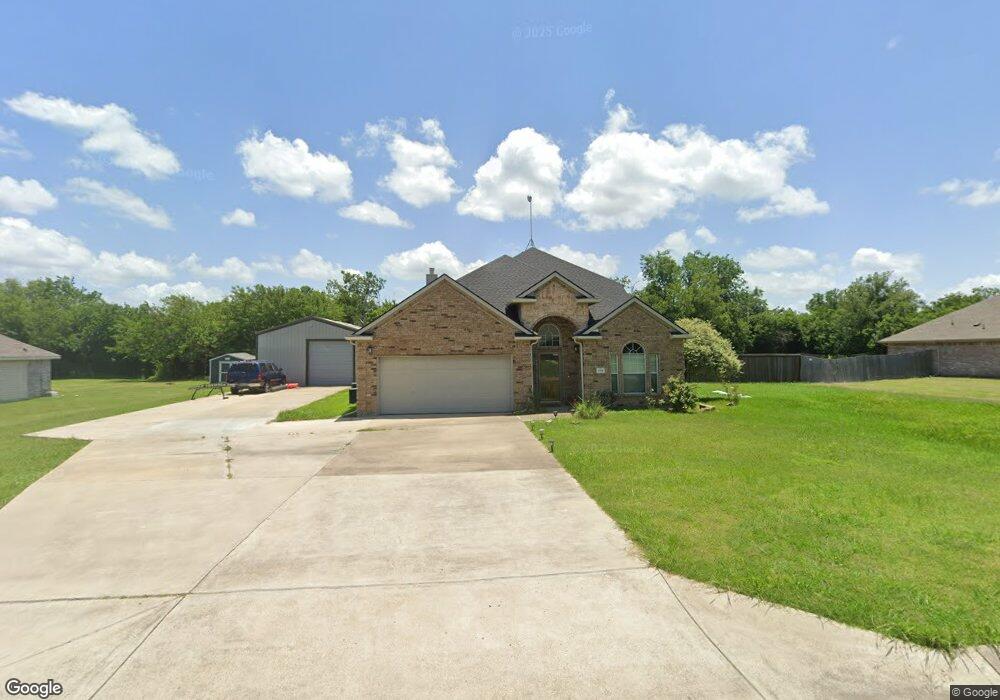
118 Valen Dr Royse City, TX 75189
Estimated Value: $437,981 - $515,000
3
Beds
3
Baths
2,477
Sq Ft
$190/Sq Ft
Est. Value
About This Home
This home is located at 118 Valen Dr, Royse City, TX 75189 and is currently estimated at $471,745, approximately $190 per square foot. 118 Valen Dr is a home located in Rockwall County with nearby schools including Harry H. Herndon Elementary School, Bobby Summers Middle School, and Royse City High School.
Ownership History
Date
Name
Owned For
Owner Type
Purchase Details
Closed on
Jun 10, 2019
Sold by
Peak Keifer and Lewis Amber L
Bought by
Garcia Lucila and Garcia Diego Juan
Current Estimated Value
Home Financials for this Owner
Home Financials are based on the most recent Mortgage that was taken out on this home.
Original Mortgage
$342,125
Outstanding Balance
$300,812
Interest Rate
4.1%
Mortgage Type
Seller Take Back
Estimated Equity
$170,933
Purchase Details
Closed on
Dec 29, 2017
Sold by
Whitford Tracie L and Whitford Eric C
Bought by
Peak Keifer
Purchase Details
Closed on
Jun 23, 2006
Sold by
Goff Homes Ltd
Bought by
Whitford Eric C and Whitford Tracie L
Home Financials for this Owner
Home Financials are based on the most recent Mortgage that was taken out on this home.
Original Mortgage
$160,000
Interest Rate
6.63%
Mortgage Type
Purchase Money Mortgage
Create a Home Valuation Report for This Property
The Home Valuation Report is an in-depth analysis detailing your home's value as well as a comparison with similar homes in the area
Home Values in the Area
Average Home Value in this Area
Purchase History
| Date | Buyer | Sale Price | Title Company |
|---|---|---|---|
| Garcia Lucila | -- | None Available | |
| Peak Keifer | -- | None Available | |
| Whitford Eric C | -- | Commonwealth Land Title Comp |
Source: Public Records
Mortgage History
| Date | Status | Borrower | Loan Amount |
|---|---|---|---|
| Open | Garcia Lucila | $342,125 | |
| Previous Owner | Whitford Eric C | $160,000 |
Source: Public Records
Tax History Compared to Growth
Tax History
| Year | Tax Paid | Tax Assessment Tax Assessment Total Assessment is a certain percentage of the fair market value that is determined by local assessors to be the total taxable value of land and additions on the property. | Land | Improvement |
|---|---|---|---|---|
| 2025 | $8,348 | $471,894 | $160,000 | $311,894 |
| 2023 | $8,348 | $460,297 | $192,000 | $268,297 |
| 2022 | $8,676 | $427,540 | $163,200 | $264,340 |
| 2021 | $6,468 | $315,300 | $98,800 | $216,500 |
| 2020 | $6,707 | $308,500 | $95,950 | $212,550 |
| 2019 | $7,027 | $306,940 | $72,600 | $234,340 |
| 2018 | $6,765 | $292,750 | $47,310 | $245,440 |
| 2017 | $5,564 | $241,420 | $42,750 | $198,670 |
| 2016 | $5,058 | $216,430 | $41,500 | $174,930 |
| 2015 | $4,144 | $200,790 | $24,000 | $176,790 |
| 2014 | $4,144 | $185,210 | $24,000 | $161,210 |
Source: Public Records
Map
Nearby Homes
- 108 Shady Springs Ln
- 125 Jerome Prairie
- 216 Grant Dr
- 1108 Blackland Rd
- 102 Packer Dr
- 506 Robinson Way
- 105 James St
- 253 Pitt Cir
- 1041 N Churchill Dr
- 108 Shelby Dr
- 102 Katie St
- 304 Eden Dr
- 227 Chamberlain Dr
- 428 Attlee Dr
- 134 Blair Dr
- 151 Cameron Dr
- 544 Laurel Ln
- 66 Larkspur Dr
- 518 Blue Sage Dr
- 523 Blue Sage Dr