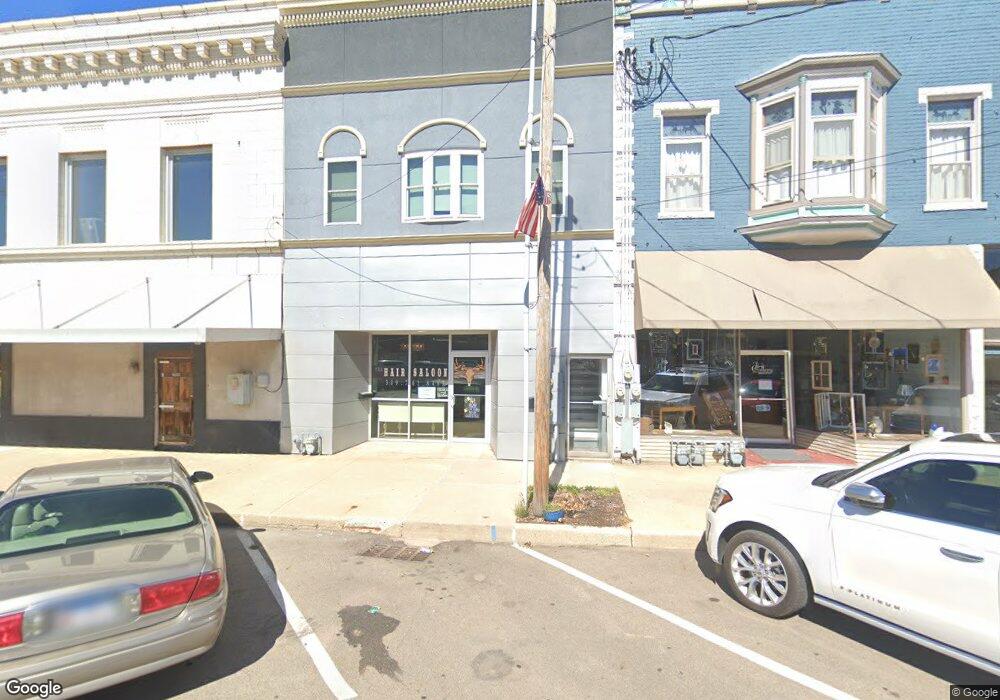
118 W 2nd St Kewanee, IL 61443
Estimated Value: $98,180
--
Bed
--
Bath
1,600
Sq Ft
$61/Sq Ft
Est. Value
About This Home
This home is located at 118 W 2nd St, Kewanee, IL 61443 and is currently estimated at $98,180, approximately $61 per square foot. 118 W 2nd St is a home located in Henry County with nearby schools including Kewanee High School and Visitation Catholic School.
Ownership History
Date
Name
Owned For
Owner Type
Purchase Details
Closed on
Jan 26, 2024
Sold by
Eljune Properties Llc
Bought by
Cone Properties Llc
Current Estimated Value
Home Financials for this Owner
Home Financials are based on the most recent Mortgage that was taken out on this home.
Original Mortgage
$85,000
Outstanding Balance
$81,913
Interest Rate
7.5%
Mortgage Type
New Conventional
Estimated Equity
$16,267
Purchase Details
Closed on
Jun 1, 2022
Sold by
Carrington Dan R and Carrington Sue E
Bought by
Eljune Properties Llc
Purchase Details
Closed on
Oct 23, 2008
Sold by
Moon Sherry L and Nichols Sherry L
Bought by
Carrington Dan R and Carrington Sue E
Home Financials for this Owner
Home Financials are based on the most recent Mortgage that was taken out on this home.
Original Mortgage
$36,400
Interest Rate
6%
Mortgage Type
Future Advance Clause Open End Mortgage
Create a Home Valuation Report for This Property
The Home Valuation Report is an in-depth analysis detailing your home's value as well as a comparison with similar homes in the area
Home Values in the Area
Average Home Value in this Area
Purchase History
| Date | Buyer | Sale Price | Title Company |
|---|---|---|---|
| Cone Properties Llc | $85,000 | None Listed On Document | |
| Eljune Properties Llc | $55,000 | None Listed On Document | |
| Carrington Dan R | $45,500 | None Available |
Source: Public Records
Mortgage History
| Date | Status | Borrower | Loan Amount |
|---|---|---|---|
| Open | Cone Properties Llc | $85,000 | |
| Previous Owner | Carrington Dan R | $36,400 |
Source: Public Records
Tax History Compared to Growth
Tax History
| Year | Tax Paid | Tax Assessment Tax Assessment Total Assessment is a certain percentage of the fair market value that is determined by local assessors to be the total taxable value of land and additions on the property. | Land | Improvement |
|---|---|---|---|---|
| 2024 | $2,159 | $20,000 | $1,365 | $18,635 |
| 2023 | $2,217 | $20,000 | $1,365 | $18,635 |
| 2022 | $2,252 | $20,000 | $1,365 | $18,635 |
| 2021 | $2,326 | $20,000 | $1,365 | $18,635 |
| 2020 | $2,286 | $19,560 | $1,335 | $18,225 |
| 2019 | $2,279 | $20,000 | $1,365 | $18,635 |
| 2018 | $2,297 | $20,000 | $1,365 | $18,635 |
| 2017 | $1,248 | $10,901 | $1,365 | $9,536 |
| 2016 | $1,188 | $10,382 | $1,300 | $9,082 |
| 2015 | $1,135 | $10,382 | $1,300 | $9,082 |
| 2013 | $1,135 | $10,382 | $1,300 | $9,082 |
Source: Public Records
Map
Nearby Homes
- 213 Elliott St
- 517 W 1st St
- 323 S Chestnut St
- 512 Commercial St
- 218 Ross St
- 201 S Grove St
- 414 E Oak St
- 716 W 3rd St
- 410 Ross St
- 422 Ross St
- 407 Ross St
- 402 W Prospect St
- 214 W 8th St
- 516 W Prospect St
- 206 Roosevelt Ave
- 115 Roosevelt Ave
- 405 Mckinley Ave
- 921 N Tremont St
- 714 S Main St
- 915 N Walnut St
- 212 N Tremont St
- 203 N Tremont St
- 205 S Main St
- 205 S Main St Unit 205 Tenney Street
- 224 N Tremont St
- 200 N Chestnut St
- 219 W 2nd St
- 227 W 2nd St
- 106 N Main St Unit 114
- 106 N Main St
- 106 N Main St Unit 110
- 300 W 3rd St
- 105 S Tremont St
- 123 N Burr Blvd
- 111 N Burr Blvd
- 116 E 1st St
- 116 E 3rd St
- 116 & 118 E 3rd St
- 101 N Burr Blvd
- 200 E 2nd St