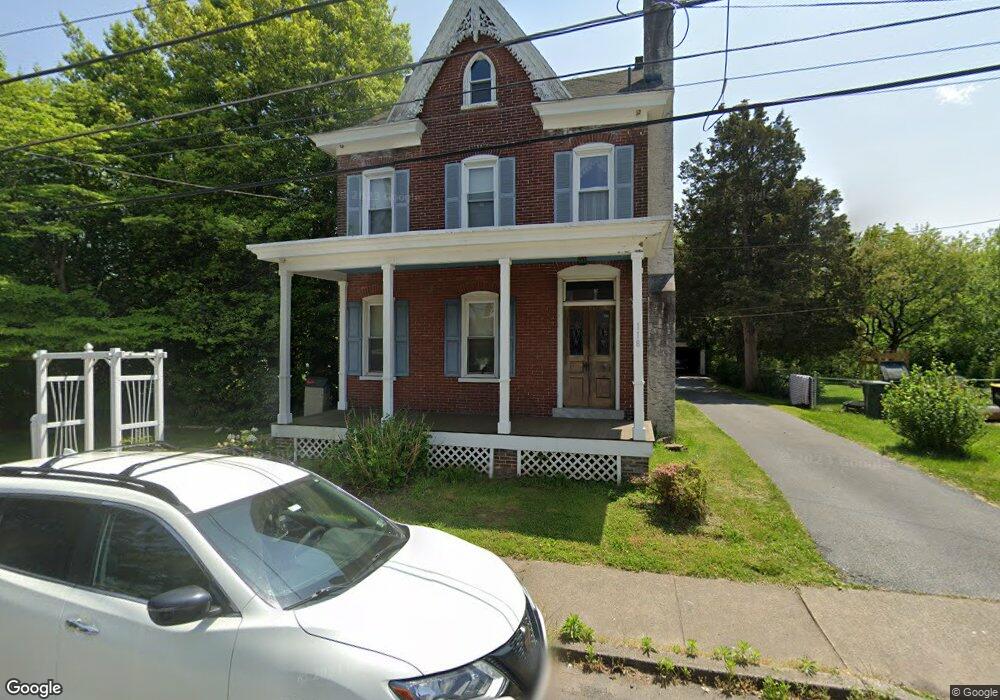
118 W Main St Pottstown, PA 19465
North Coventry NeighborhoodEstimated Value: $352,000 - $436,599
4
Beds
2
Baths
2,800
Sq Ft
$140/Sq Ft
Est. Value
About This Home
This home is located at 118 W Main St, Pottstown, PA 19465 and is currently estimated at $391,650, approximately $139 per square foot. 118 W Main St is a home located in Chester County with nearby schools including North Coventry Elementary School, Owen J Roberts Middle School, and Owen J Roberts High School.
Ownership History
Date
Name
Owned For
Owner Type
Purchase Details
Closed on
Oct 8, 2014
Sold by
Peterson Kurt A and Peterson Cheryl A
Bought by
Peterson Kurt A
Current Estimated Value
Home Financials for this Owner
Home Financials are based on the most recent Mortgage that was taken out on this home.
Original Mortgage
$228,000
Outstanding Balance
$174,795
Interest Rate
4.1%
Mortgage Type
New Conventional
Estimated Equity
$216,855
Purchase Details
Closed on
Sep 26, 2008
Sold by
Metz Robert E and Metz Christine A
Bought by
Peterson Kurt A and Peterson Cheryl A
Home Financials for this Owner
Home Financials are based on the most recent Mortgage that was taken out on this home.
Original Mortgage
$235,553
Interest Rate
6.43%
Mortgage Type
FHA
Create a Home Valuation Report for This Property
The Home Valuation Report is an in-depth analysis detailing your home's value as well as a comparison with similar homes in the area
Home Values in the Area
Average Home Value in this Area
Purchase History
| Date | Buyer | Sale Price | Title Company |
|---|---|---|---|
| Peterson Kurt A | -- | None Available | |
| Peterson Kurt A | $238,000 | Lawyers Title Ins |
Source: Public Records
Mortgage History
| Date | Status | Borrower | Loan Amount |
|---|---|---|---|
| Open | Peterson Kurt A | $228,000 | |
| Closed | Peterson Kurt A | $235,553 |
Source: Public Records
Tax History Compared to Growth
Tax History
| Year | Tax Paid | Tax Assessment Tax Assessment Total Assessment is a certain percentage of the fair market value that is determined by local assessors to be the total taxable value of land and additions on the property. | Land | Improvement |
|---|---|---|---|---|
| 2025 | $4,127 | $97,450 | $16,610 | $80,840 |
| 2024 | $4,127 | $97,450 | $16,610 | $80,840 |
| 2023 | $4,070 | $97,450 | $16,610 | $80,840 |
| 2022 | $3,986 | $97,450 | $16,610 | $80,840 |
| 2021 | $3,916 | $97,450 | $16,610 | $80,840 |
| 2020 | $3,818 | $97,450 | $16,610 | $80,840 |
| 2019 | $63 | $97,450 | $16,610 | $80,840 |
| 2018 | $3,647 | $97,450 | $16,610 | $80,840 |
| 2017 | $3,552 | $97,450 | $16,610 | $80,840 |
| 2016 | $2,842 | $97,450 | $16,610 | $80,840 |
| 2015 | $2,842 | $97,450 | $16,610 | $80,840 |
| 2014 | $2,842 | $97,450 | $16,610 | $80,840 |
Source: Public Records
Map
Nearby Homes