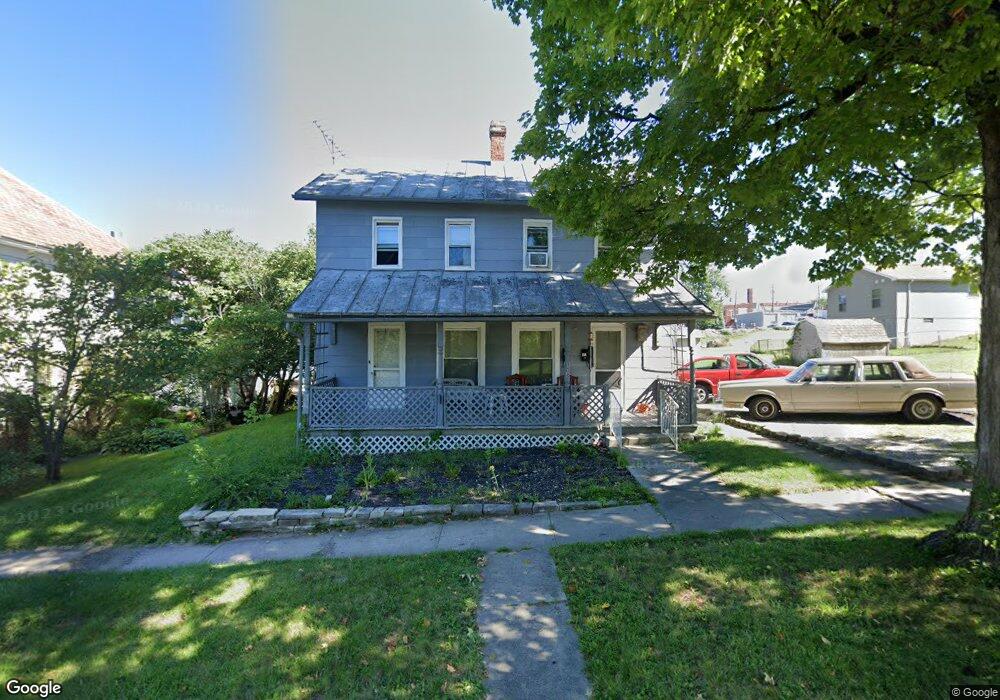
118 W Marion St Unit & 118 1/2 Mount Gilead, OH 43338
Estimated Value: $123,000 - $145,000
3
Beds
2
Baths
1,680
Sq Ft
$80/Sq Ft
Est. Value
About This Home
This home is located at 118 W Marion St Unit & 118 1/2, Mount Gilead, OH 43338 and is currently estimated at $133,795, approximately $79 per square foot. 118 W Marion St Unit & 118 1/2 is a home located in Morrow County with nearby schools including Park Avenue Elementary School, Mt Gilead Middle School, and Mt Gilead High School.
Ownership History
Date
Name
Owned For
Owner Type
Purchase Details
Closed on
Aug 16, 2021
Bought by
Paul J Bryan
Current Estimated Value
Home Financials for this Owner
Home Financials are based on the most recent Mortgage that was taken out on this home.
Interest Rate
2.87%
Purchase Details
Closed on
Mar 4, 2019
Sold by
Bumgardner John
Bought by
Bumgardner Beth
Purchase Details
Closed on
Jul 3, 2018
Sold by
Porter Kinzie M and Lantini Kinzie
Bought by
Bumgardner John and Bumgardner Beth
Purchase Details
Closed on
Jun 27, 2013
Sold by
Harden Patricia and Poole Cheryl Jean
Bought by
Porter Kinzie M
Home Financials for this Owner
Home Financials are based on the most recent Mortgage that was taken out on this home.
Original Mortgage
$47,200
Interest Rate
3.83%
Mortgage Type
Stand Alone First
Purchase Details
Closed on
Jul 15, 2008
Sold by
Poole Poole C C and Poole Roy M Poole
Bought by
Poole C Jean
Purchase Details
Closed on
Apr 25, 1988
Bought by
Poole C Jean And
Create a Home Valuation Report for This Property
The Home Valuation Report is an in-depth analysis detailing your home's value as well as a comparison with similar homes in the area
Home Values in the Area
Average Home Value in this Area
Purchase History
| Date | Buyer | Sale Price | Title Company |
|---|---|---|---|
| Paul J Bryan | $84,000 | -- | |
| Bumgardner Beth | -- | -- | |
| Bumgardner John | $72,000 | -- | |
| Porter Kinzie M | -- | -- | |
| Poole C Jean | -- | -- | |
| Poole C Jean And | -- | -- |
Source: Public Records
Mortgage History
| Date | Status | Borrower | Loan Amount |
|---|---|---|---|
| Closed | Paul J Bryan | -- | |
| Previous Owner | Porter Kinzie M | $47,200 |
Source: Public Records
Tax History Compared to Growth
Tax History
| Year | Tax Paid | Tax Assessment Tax Assessment Total Assessment is a certain percentage of the fair market value that is determined by local assessors to be the total taxable value of land and additions on the property. | Land | Improvement |
|---|---|---|---|---|
| 2024 | $1,326 | $28,460 | $6,230 | $22,230 |
| 2023 | $1,263 | $28,460 | $6,230 | $22,230 |
| 2022 | $1,372 | $27,830 | $5,390 | $22,440 |
| 2021 | $1,306 | $27,830 | $5,390 | $22,440 |
| 2020 | $1,307 | $27,830 | $5,390 | $22,440 |
| 2019 | $1,154 | $24,190 | $4,690 | $19,500 |
| 2018 | $1,155 | $24,190 | $4,690 | $19,500 |
| 2017 | $1,127 | $24,190 | $4,690 | $19,500 |
| 2016 | $903 | $19,150 | $3,780 | $15,370 |
| 2015 | $845 | $19,150 | $3,780 | $15,370 |
| 2014 | $857 | $19,150 | $3,780 | $15,370 |
| 2013 | $914 | $21,280 | $4,200 | $17,080 |
Source: Public Records
Map
Nearby Homes
- 69 N Cherry St
- 250 S Main St
- 186 Iberia St
- 236 W High St
- 264 W High St
- 0 Iberia St
- 362 W High St
- 0 Tamarack Unit 223034150
- 5098 County Road 237
- 0 Lee St
- 574 Buckeye Ln
- 669 Baker St
- 730 W Marion St
- 5720 County Road 30
- 5171 U S 42
- 150 E High St
- 0 Township Road 110 Unit 6131011
- 4350 Township Road 110
- 135 High St
- 5221 County Road 9