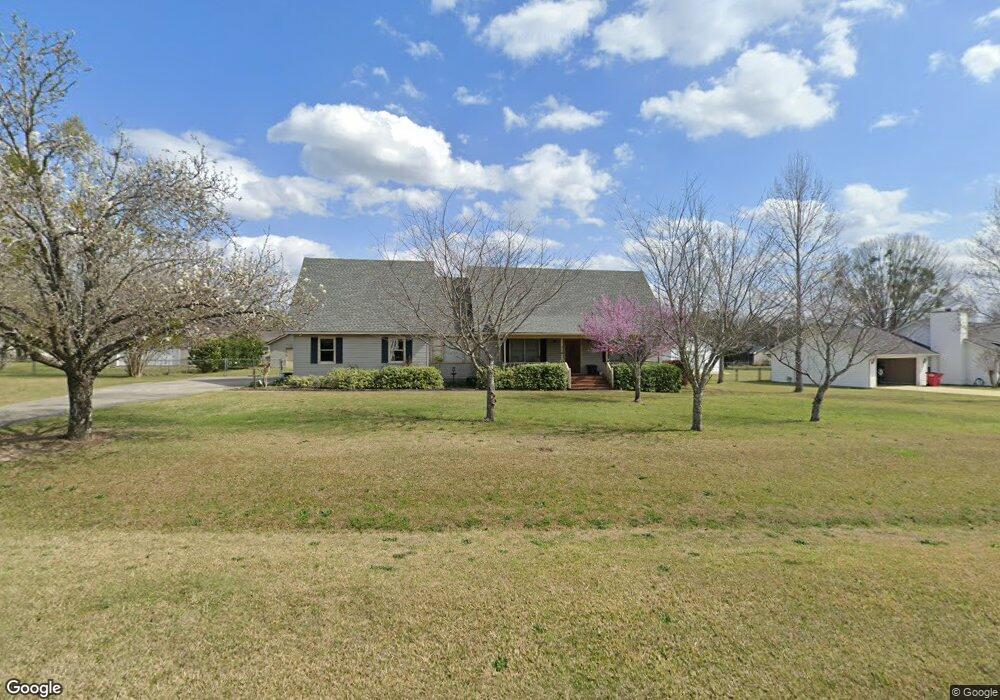
118 Walden Ct Macon, GA 31216
Estimated Value: $250,000 - $321,000
3
Beds
3
Baths
2,204
Sq Ft
$133/Sq Ft
Est. Value
About This Home
This home is located at 118 Walden Ct, Macon, GA 31216 and is currently estimated at $292,986, approximately $132 per square foot. 118 Walden Ct is a home located in Bibb County with nearby schools including Heard Elementary School, Rutland Middle School, and Rutland High School.
Ownership History
Date
Name
Owned For
Owner Type
Purchase Details
Closed on
Jun 24, 2011
Sold by
Federal Home Loan Mortgage Corporation
Bought by
Brown Gregory
Current Estimated Value
Home Financials for this Owner
Home Financials are based on the most recent Mortgage that was taken out on this home.
Original Mortgage
$129,140
Outstanding Balance
$88,159
Interest Rate
4.5%
Mortgage Type
FHA
Estimated Equity
$204,827
Purchase Details
Closed on
Mar 1, 2011
Sold by
Citimortgage Inc
Bought by
Federal Home Loan Mortgage Corp
Purchase Details
Closed on
Oct 16, 2007
Sold by
Arlington John D
Bought by
Arlington John D and John D Arlington Trust
Purchase Details
Closed on
Oct 4, 2006
Sold by
Arlington Leslie R
Bought by
Arlington John D
Purchase Details
Closed on
Jul 28, 2005
Purchase Details
Closed on
Jul 13, 2000
Create a Home Valuation Report for This Property
The Home Valuation Report is an in-depth analysis detailing your home's value as well as a comparison with similar homes in the area
Home Values in the Area
Average Home Value in this Area
Purchase History
| Date | Buyer | Sale Price | Title Company |
|---|---|---|---|
| Brown Gregory | $132,500 | None Available | |
| Federal Home Loan Mortgage Corp | -- | None Available | |
| Citimortgage Inc | $150,284 | None Available | |
| Arlington John D | -- | None Available | |
| Arlington John D | -- | None Avelable | |
| -- | $150,000 | -- | |
| -- | $139,500 | -- |
Source: Public Records
Mortgage History
| Date | Status | Borrower | Loan Amount |
|---|---|---|---|
| Open | Brown Gregory | $129,140 |
Source: Public Records
Tax History Compared to Growth
Tax History
| Year | Tax Paid | Tax Assessment Tax Assessment Total Assessment is a certain percentage of the fair market value that is determined by local assessors to be the total taxable value of land and additions on the property. | Land | Improvement |
|---|---|---|---|---|
| 2025 | $2,111 | $92,894 | $18,000 | $74,894 |
| 2024 | $2,181 | $92,894 | $18,000 | $74,894 |
| 2023 | $1,724 | $92,894 | $18,000 | $74,894 |
| 2022 | $2,186 | $70,137 | $10,080 | $60,057 |
| 2021 | $2,399 | $70,137 | $10,080 | $60,057 |
| 2020 | $2,451 | $70,137 | $10,080 | $60,057 |
| 2019 | $2,471 | $70,137 | $10,080 | $60,057 |
| 2018 | $3,965 | $70,137 | $10,080 | $60,057 |
| 2017 | $2,365 | $70,137 | $10,080 | $60,057 |
| 2016 | $2,184 | $70,137 | $10,080 | $60,057 |
| 2015 | $3,088 | $70,048 | $10,080 | $59,968 |
| 2014 | $3,436 | $70,048 | $10,080 | $59,968 |
Source: Public Records
Map
Nearby Homes
- 3926 Juanita Dr
- 465 Bob White Rd
- 408 Resting Fawn Place
- 3160 Walden Rd
- 7530 Houston Rd
- DUPONT Plan at Quail Ridge
- GARDNER Plan at Quail Ridge
- KINGSTON Plan at Quail Ridge
- ESSEX Plan at Quail Ridge
- 428 Bob White Rd
- 411 Bob White Rd
- 708 Coopers Lnd
- 436 Joseph Chandler Dr
- 116 Wynens Way
- 7515 Goodall Mill Rd
- 7530 Rhea Ln
- 7237 Winterberry Cir
- 7225 Winterberry Cir
- 7511, 7579, 7595, 76 Nowell Rd S
- 124 Walden Ct
- 112 Walden Ct
- 336 Walden Station Dr
- 0 Walden Ct Unit 8646252
- 0 Walden Ct Unit 3100728
- 0 Walden Ct
- 326 Walden Station Dr
- 119 Walden Ct
- 130 Walden Ct
- 111 Walden Ct
- 342 Walden Station Dr
- 125 Walden Ct
- 300 Walden Station Dr
- 314 Walden Station Dr
- 105 Walden Ct
- 131 Walden Ct
- 331 Walden Station Dr
- 136 Walden Ct
- 136 Walden Ct Unit 134
- 337 Walden Station Dr