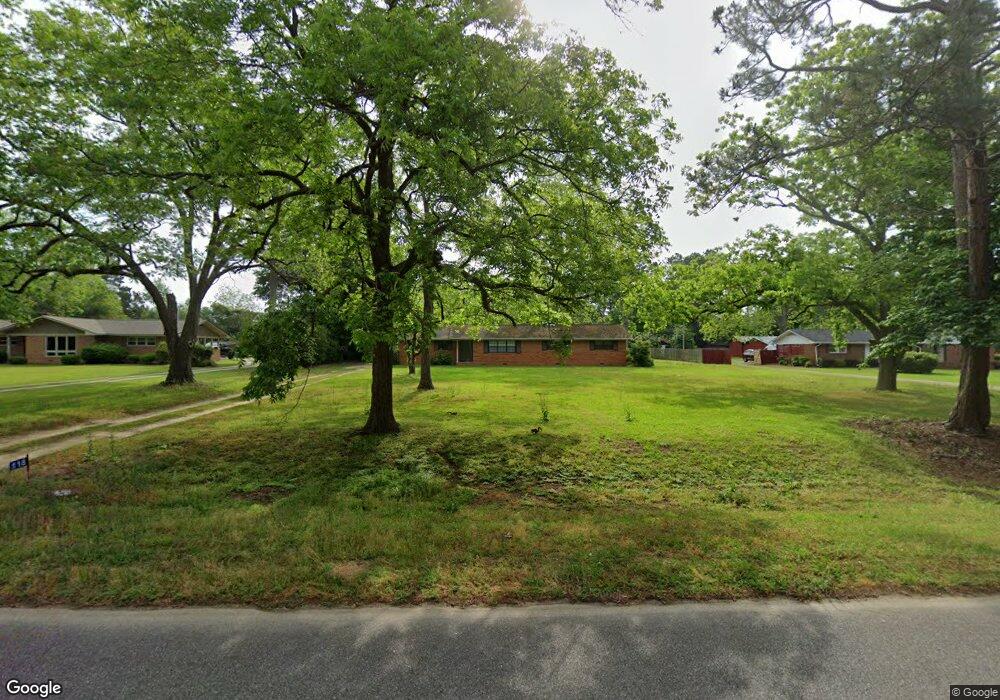
118 Walker Ave Fitzgerald, GA 31750
Estimated Value: $149,000 - $177,000
4
Beds
3
Baths
2,256
Sq Ft
$71/Sq Ft
Est. Value
About This Home
This home is located at 118 Walker Ave, Fitzgerald, GA 31750 and is currently estimated at $159,629, approximately $70 per square foot. 118 Walker Ave is a home located in Ben Hill County with nearby schools including Ben Hill County Primary School, Ben Hill Elementary School, and Ben Hill County Middle School.
Ownership History
Date
Name
Owned For
Owner Type
Purchase Details
Closed on
Jul 1, 2021
Sold by
Harper Louis E
Bought by
L E Harper Commercial Properties Llc
Current Estimated Value
Purchase Details
Closed on
Apr 6, 2010
Sold by
Waters Edwina M
Bought by
Harper Louis E and Harper Jacquelyn D
Home Financials for this Owner
Home Financials are based on the most recent Mortgage that was taken out on this home.
Original Mortgage
$60,350
Interest Rate
4.94%
Mortgage Type
Future Advance Clause Open End Mortgage
Purchase Details
Closed on
Jan 20, 2001
Sold by
Smith Steve
Bought by
Waters Frank M
Purchase Details
Closed on
Dec 11, 1998
Sold by
Duke Paula Eileen B
Bought by
Smith Steve
Purchase Details
Closed on
Nov 8, 1996
Sold by
Duke Fred and Duke Paula
Bought by
Duke Paula Eileen B
Purchase Details
Closed on
Aug 2, 1994
Sold by
Graham Ocie L
Bought by
Duke Fred and Duke Paula
Purchase Details
Closed on
Jul 7, 1971
Bought by
Graham Ocie L
Create a Home Valuation Report for This Property
The Home Valuation Report is an in-depth analysis detailing your home's value as well as a comparison with similar homes in the area
Home Values in the Area
Average Home Value in this Area
Purchase History
| Date | Buyer | Sale Price | Title Company |
|---|---|---|---|
| L E Harper Commercial Properties Llc | -- | -- | |
| Harper Louis E | $60,000 | -- | |
| Waters Frank M | $60,000 | -- | |
| Smith Steve | $55,000 | -- | |
| Duke Paula Eileen B | -- | -- | |
| Duke Fred | $62,500 | -- | |
| Graham Ocie L | -- | -- |
Source: Public Records
Mortgage History
| Date | Status | Borrower | Loan Amount |
|---|---|---|---|
| Previous Owner | Harper Louis E | $60,350 |
Source: Public Records
Tax History Compared to Growth
Tax History
| Year | Tax Paid | Tax Assessment Tax Assessment Total Assessment is a certain percentage of the fair market value that is determined by local assessors to be the total taxable value of land and additions on the property. | Land | Improvement |
|---|---|---|---|---|
| 2024 | $1,261 | $41,108 | $3,600 | $37,508 |
| 2023 | $1,227 | $40,025 | $3,600 | $36,425 |
| 2022 | $1,152 | $34,848 | $3,600 | $31,248 |
| 2021 | $1,110 | $32,319 | $3,600 | $28,719 |
| 2020 | $1,117 | $32,138 | $3,600 | $28,538 |
| 2019 | $1,113 | $32,138 | $3,600 | $28,538 |
| 2018 | $1,057 | $31,958 | $3,600 | $28,358 |
| 2017 | $1,104 | $31,717 | $3,600 | $28,117 |
| 2016 | $1,058 | $31,830 | $3,600 | $28,230 |
| 2015 | -- | $32,108 | $3,600 | $28,508 |
| 2014 | -- | $32,664 | $3,600 | $29,064 |
Source: Public Records
Map
Nearby Homes
- 138 Azalea Ln
- 277 Lincoln Ave
- 271 Lincoln Ave
- 249 Lincoln Ave
- 111 Duane Dr
- 204 Irwinville Hwy
- 0 Irwinville Hwy
- 200 Irwinville Hwy
- 0 Lincoln Ave
- 109 Pearl Place
- 160 Lakeview Dr
- 105 Halsey St
- 137 Atlantic Ave
- 1171 W Roanoke Dr Ext None
- 141 Turner Ave
- 118 Patton Ave
- 107 Manassas Place
- 118 Irwinville Hwy
- 152 David Dr
- 178 Burnside Rd
- 124 Walker Ave
- 114 Walker Ave
- 118 Snowden Loop
- 122 Snowden Loop
- 116 Snowden Loop
- 108 Walker Ave
- 128 Walker Ave
- 126 Snowden Loop
- 114 Snowden Loop
- 121 Snowden Loop
- 125 Snowden Loop
- 112 Snowden Loop
- 117 Snowden Loop
- 102 Walker Ave
- 132 Snowden Loop
- 110 Snowden Loop
- 137 Snowden Loop
- 134 Snowden Loop
- 105 Snowden Loop
- 106 Snowden Loop