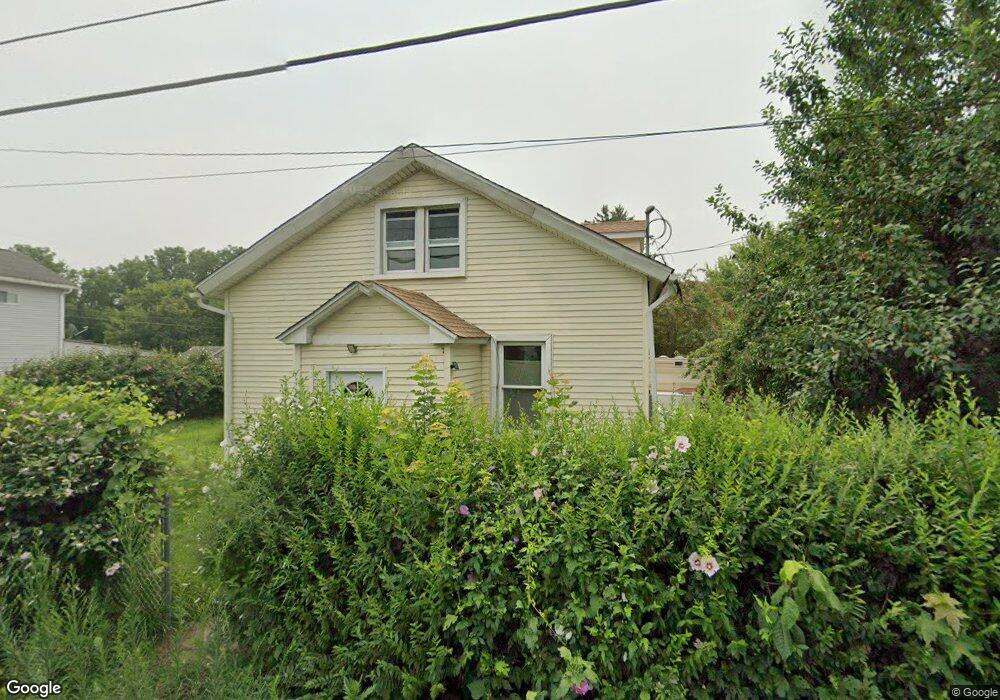
118 Walnut Dr Berwick, PA 18603
Estimated Value: $147,059 - $158,000
3
Beds
1
Bath
1,167
Sq Ft
$129/Sq Ft
Est. Value
About This Home
This home is located at 118 Walnut Dr, Berwick, PA 18603 and is currently estimated at $150,515, approximately $128 per square foot. 118 Walnut Dr is a home located in Luzerne County with nearby schools including Berwick Area High School, New Story School, and Heritage Christian Academy.
Ownership History
Date
Name
Owned For
Owner Type
Purchase Details
Closed on
Feb 25, 2020
Sold by
Khalifa Leah Mccreary
Bought by
Rodriguez Jose R
Current Estimated Value
Purchase Details
Closed on
Aug 29, 2019
Sold by
Federal Home Loan Mortgage Corporation
Bought by
Mccreary Khalifa Leah
Purchase Details
Closed on
Jun 25, 2018
Sold by
Beamon Leo and Nationstar Mortgage Llc
Bought by
Federal Home Loan Mortgage Corporation
Purchase Details
Closed on
Feb 27, 2009
Sold by
Frields Joann L and Frields Joann
Bought by
Beamon Leo
Home Financials for this Owner
Home Financials are based on the most recent Mortgage that was taken out on this home.
Original Mortgage
$59,200
Interest Rate
5.18%
Mortgage Type
Unknown
Purchase Details
Closed on
Apr 9, 2008
Sold by
Frields Daniel B
Bought by
Frields Joann L
Create a Home Valuation Report for This Property
The Home Valuation Report is an in-depth analysis detailing your home's value as well as a comparison with similar homes in the area
Home Values in the Area
Average Home Value in this Area
Purchase History
| Date | Buyer | Sale Price | Title Company |
|---|---|---|---|
| Rodriguez Jose R | $16,000 | None Available | |
| Mccreary Khalifa Leah | $8,500 | Bilbow Abstract Llc | |
| Federal Home Loan Mortgage Corporation | $1,584 | None Available | |
| Beamon Leo | $74,000 | None Available | |
| Frields Joann L | -- | None Available |
Source: Public Records
Mortgage History
| Date | Status | Borrower | Loan Amount |
|---|---|---|---|
| Previous Owner | Beamon Leo | $59,200 |
Source: Public Records
Tax History
| Year | Tax Paid | Tax Assessment Tax Assessment Total Assessment is a certain percentage of the fair market value that is determined by local assessors to be the total taxable value of land and additions on the property. | Land | Improvement |
|---|---|---|---|---|
| 2026 | $1,536 | $67,300 | $26,900 | $40,400 |
| 2025 | $1,516 | $67,300 | $26,900 | $40,400 |
| 2024 | $1,470 | $67,300 | $26,900 | $40,400 |
| 2023 | $1,412 | $67,300 | $26,900 | $40,400 |
| 2022 | $1,399 | $67,300 | $26,900 | $40,400 |
| 2021 | $1,399 | $67,300 | $26,900 | $40,400 |
| 2020 | $1,399 | $67,300 | $26,900 | $40,400 |
| 2019 | $1,200 | $67,300 | $26,900 | $40,400 |
| 2018 | $1,191 | $67,300 | $26,900 | $40,400 |
| 2017 | $1,245 | $67,300 | $26,900 | $40,400 |
| 2016 | -- | $67,300 | $26,900 | $40,400 |
| 2015 | -- | $67,300 | $26,900 | $40,400 |
| 2014 | -- | $67,300 | $26,900 | $40,400 |
Source: Public Records
Map
Nearby Homes
Your Personal Tour Guide
Ask me questions while you tour the home.