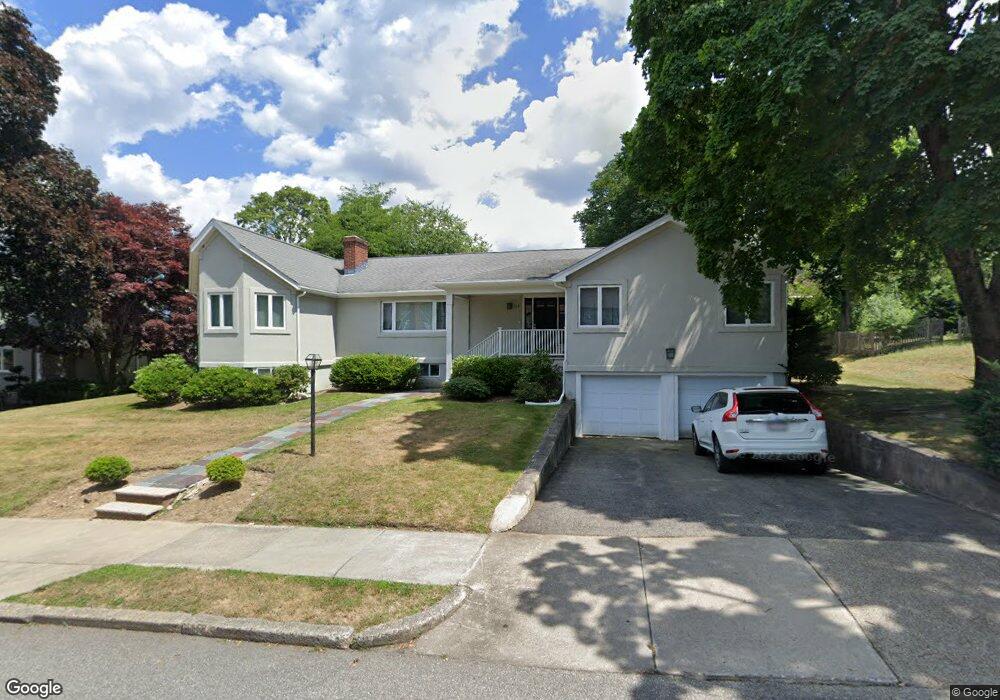
118 Wendell Rd Newton Center, MA 02459
Newton Highlands NeighborhoodEstimated Value: $1,493,000 - $1,856,000
3
Beds
4
Baths
2,209
Sq Ft
$757/Sq Ft
Est. Value
About This Home
This home is located at 118 Wendell Rd, Newton Center, MA 02459 and is currently estimated at $1,671,964, approximately $756 per square foot. 118 Wendell Rd is a home located in Middlesex County with nearby schools including Countryside Elementary School, Charles E Brown Middle School, and Newton South High School.
Ownership History
Date
Name
Owned For
Owner Type
Purchase Details
Closed on
Jul 30, 2025
Sold by
Dagata Erika M
Bought by
Erika M Dagata 2025 T M and Erika Dagata
Current Estimated Value
Purchase Details
Closed on
May 22, 2015
Sold by
Mount David B and Dagata Erika M
Bought by
Dagata Erika M
Create a Home Valuation Report for This Property
The Home Valuation Report is an in-depth analysis detailing your home's value as well as a comparison with similar homes in the area
Home Values in the Area
Average Home Value in this Area
Purchase History
| Date | Buyer | Sale Price | Title Company |
|---|---|---|---|
| Erika M Dagata 2025 T M | -- | -- | |
| Erika M Dagata 2025 T M | -- | -- | |
| Dagata Erika M | $211,416 | -- | |
| Dagata Erika M | $211,416 | -- |
Source: Public Records
Tax History Compared to Growth
Tax History
| Year | Tax Paid | Tax Assessment Tax Assessment Total Assessment is a certain percentage of the fair market value that is determined by local assessors to be the total taxable value of land and additions on the property. | Land | Improvement |
|---|---|---|---|---|
| 2025 | $12,739 | $1,299,900 | $1,107,700 | $192,200 |
| 2024 | $12,317 | $1,262,000 | $1,075,400 | $186,600 |
| 2023 | $11,772 | $1,156,400 | $837,000 | $319,400 |
| 2022 | $11,264 | $1,070,700 | $775,000 | $295,700 |
| 2021 | $10,869 | $1,010,100 | $731,100 | $279,000 |
| 2020 | $10,545 | $1,010,100 | $731,100 | $279,000 |
| 2019 | $10,248 | $980,700 | $709,800 | $270,900 |
| 2018 | $9,910 | $915,900 | $648,600 | $267,300 |
| 2017 | $9,609 | $864,100 | $611,900 | $252,200 |
| 2016 | $9,190 | $807,600 | $571,900 | $235,700 |
| 2015 | -- | $754,800 | $534,500 | $220,300 |
Source: Public Records
Map
Nearby Homes
- 36 Cannon St
- 15 Buff Cir
- 250 Woodcliff Rd
- 415 Dedham St Unit D
- 51 Carl St
- 116 Upland Ave
- 19 Selwyn Rd
- 45 Brandeis Rd
- 58 Country Club Rd
- 1308 Walnut St
- 1292 Walnut St
- 36 Roland St
- 128 Charlemont St
- 125 Oakdale Rd
- 35 Haynes Rd
- 671 Boylston St
- 628 Boylston St
- 21 Philbrick Rd
- 65 Levbert Rd
- 625 Boylston St