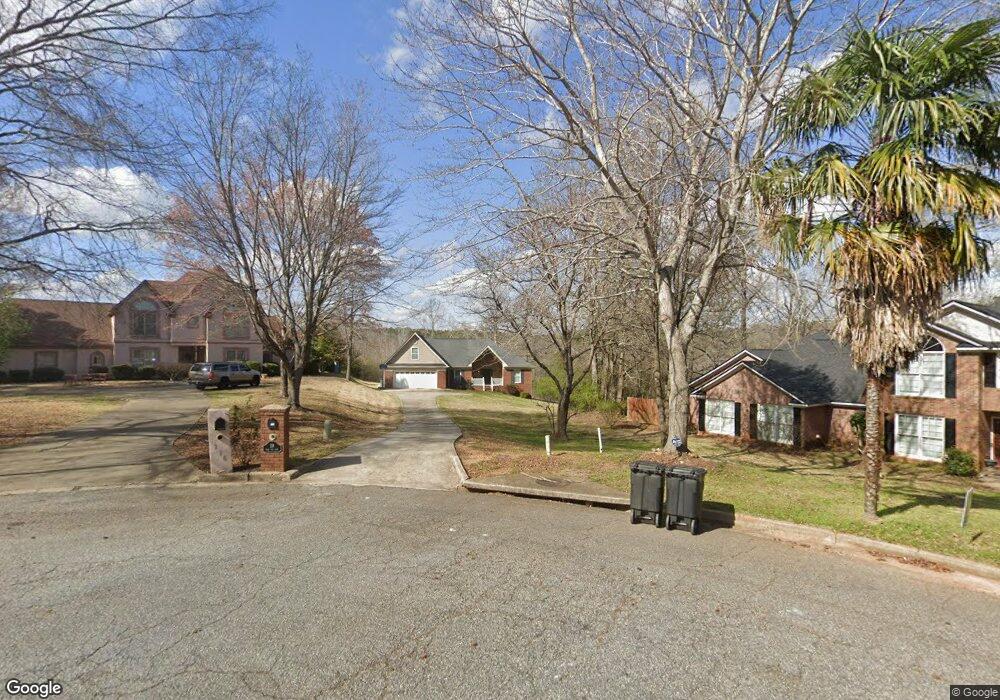
118 Wild Fox Ln Midland, GA 31820
Midland NeighborhoodEstimated Value: $375,381 - $446,000
4
Beds
3
Baths
2,665
Sq Ft
$154/Sq Ft
Est. Value
About This Home
This home is located at 118 Wild Fox Ln, Midland, GA 31820 and is currently estimated at $409,595, approximately $153 per square foot. 118 Wild Fox Ln is a home with nearby schools including Pine Ridge Elementary School, Cogburn Woods Elementary School, and Harris County Carver Middle School.
Ownership History
Date
Name
Owned For
Owner Type
Purchase Details
Closed on
Dec 4, 2012
Sold by
Wells Stephen L
Bought by
Wells Stephen L and Wells Alexis J
Current Estimated Value
Home Financials for this Owner
Home Financials are based on the most recent Mortgage that was taken out on this home.
Original Mortgage
$229,000
Outstanding Balance
$157,183
Interest Rate
3.4%
Mortgage Type
New Conventional
Estimated Equity
$252,412
Purchase Details
Closed on
Nov 13, 2012
Sold by
Ronald Hall Builders Inc
Bought by
Wells Stephen L
Home Financials for this Owner
Home Financials are based on the most recent Mortgage that was taken out on this home.
Original Mortgage
$229,000
Outstanding Balance
$157,183
Interest Rate
3.4%
Mortgage Type
New Conventional
Estimated Equity
$252,412
Purchase Details
Closed on
May 1, 2012
Sold by
Cjc Partners Llc
Bought by
Ronald Hall Builder Inc
Purchase Details
Closed on
Mar 6, 2012
Sold by
Foxchase Lp
Bought by
Cjc Partners Llc
Create a Home Valuation Report for This Property
The Home Valuation Report is an in-depth analysis detailing your home's value as well as a comparison with similar homes in the area
Home Values in the Area
Average Home Value in this Area
Purchase History
| Date | Buyer | Sale Price | Title Company |
|---|---|---|---|
| Wells Stephen L | -- | -- | |
| Wells Stephen L | $229,000 | -- | |
| Ronald Hall Builder Inc | $40,000 | -- | |
| Cjc Partners Llc | -- | -- |
Source: Public Records
Mortgage History
| Date | Status | Borrower | Loan Amount |
|---|---|---|---|
| Open | Wells Stephen L | $229,000 |
Source: Public Records
Tax History Compared to Growth
Tax History
| Year | Tax Paid | Tax Assessment Tax Assessment Total Assessment is a certain percentage of the fair market value that is determined by local assessors to be the total taxable value of land and additions on the property. | Land | Improvement |
|---|---|---|---|---|
| 2025 | $3,837 | $147,068 | $16,000 | $131,068 |
| 2024 | $3,565 | $132,142 | $16,000 | $116,142 |
| 2023 | $2,631 | $114,371 | $16,000 | $98,371 |
| 2022 | $3,092 | $114,371 | $16,000 | $98,371 |
| 2021 | $3,094 | $110,415 | $16,000 | $94,415 |
| 2020 | $2,979 | $106,248 | $16,000 | $90,248 |
| 2019 | $2,873 | $106,248 | $16,000 | $90,248 |
| 2018 | $2,932 | $106,248 | $16,000 | $90,248 |
| 2017 | $2,933 | $106,248 | $16,000 | $90,248 |
| 2016 | $2,645 | $104,942 | $16,000 | $88,942 |
| 2015 | $2,562 | $101,366 | $16,000 | $85,366 |
| 2014 | $2,566 | $101,366 | $16,000 | $85,366 |
| 2013 | -- | $101,365 | $16,000 | $85,365 |
Source: Public Records
Map
Nearby Homes
- 365 Fox Chase Trail
- 178 Rolling Farm Way
- Lot 15 Oversee Ct
- 1009 Crosswinds Dr
- 1038 Crosswinds Dr
- 10543 County Line Rd
- 1048 Crosswinds Dr
- 51 Ironwood Ct
- 51 Ironwood Ct Unit 90
- 8848 Westwind Dr
- 10304 Emerson Way
- 1049 Crosswinds Dr
- 10316 Emerson Way
- 8904 Lilly Rock Way
- 303 Rocky Springs Dr
- 680 Kristi Lynns Way
- 8599 Freedom Trail
- 10176 Sable Ct
- 8485 Liberty Hall Dr
- 1140 Central Church Rd
- 116 Wild Fox Ln
- 122 Wild Fox Ln
- 69 Wild Fox Ln
- 88 Wild Fox Ln
- 61 Wild Fox Ln
- 64 Wild Fox Ln
- 44 Wild Fox Ln
- 25 Wild Fox Ln
- 311 Fox Chase Trail
- 35 Huntmaster Ct
- 337 Fox Chase Trail
- 29 Huntmaster Ct
- 24 Wild Fox Ln
- 275 Fox Chase Trail
- 15 Wild Fox Ln
- 13 Lake Point Trail
- 24 Huntmaster Ct
- 31 Lake Point Trail
- 253 Fox Chase Trail
- 69 Lake Point Trail