Estimated Value: $336,344 - $458,000
4
Beds
3
Baths
2,854
Sq Ft
$135/Sq Ft
Est. Value
About This Home
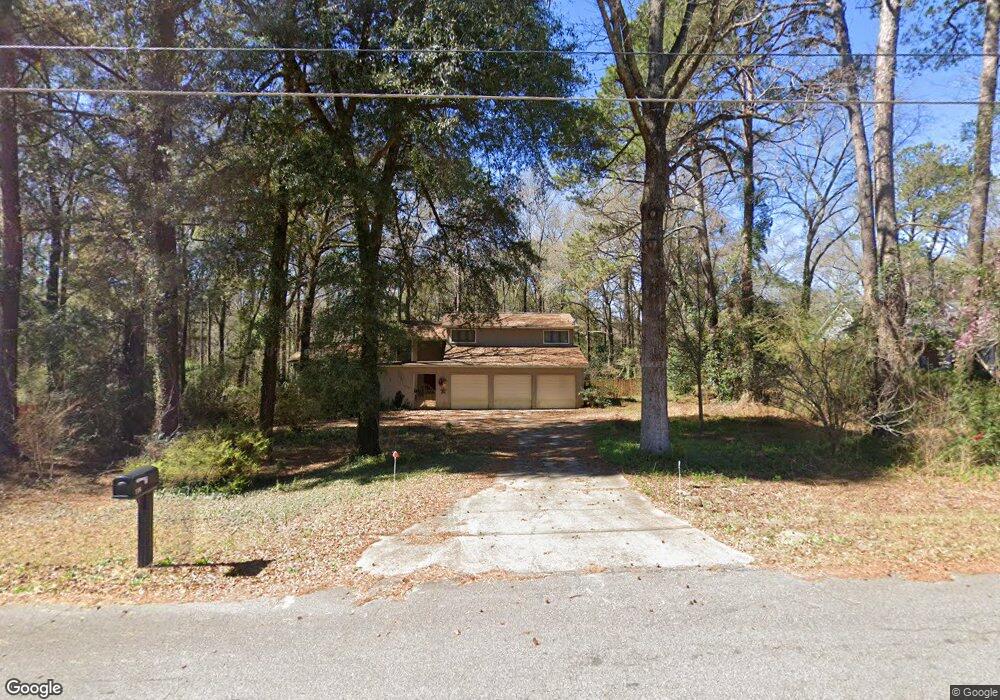
This home is located at 118 Wimbish Way, Perry, GA 31069 and is currently estimated at $386,586, approximately $135 per square foot. 118 Wimbish Way is a home located in Houston County with nearby schools including Kings Chapel Elementary School, Perry Middle School, and Perry High School.
Ownership History
Date
Name
Owned For
Owner Type
Purchase Details
Closed on
Apr 25, 2011
Sold by
Walkup Angela M
Bought by
Chappell William E
Current Estimated Value
Home Financials for this Owner
Home Financials are based on the most recent Mortgage that was taken out on this home.
Original Mortgage
$196,166
Outstanding Balance
$135,444
Interest Rate
4.74%
Mortgage Type
VA
Estimated Equity
$251,142
Purchase Details
Closed on
Jan 22, 2007
Sold by
Whaley Ronald L and Whaley Barbara A
Bought by
Walkup Angela M
Home Financials for this Owner
Home Financials are based on the most recent Mortgage that was taken out on this home.
Original Mortgage
$235,350
Interest Rate
6.05%
Mortgage Type
New Conventional
Purchase Details
Closed on
Mar 21, 1995
Sold by
Hall Julia C
Bought by
Whaley Ronald L and Barbara A*
Purchase Details
Closed on
Aug 29, 1994
Sold by
Hall Jerry D and Hall Julia C
Bought by
Hall Julia C
Purchase Details
Closed on
Apr 16, 1986
Sold by
Meeks Lewis M Etal
Bought by
Hall Jerry D and Hall Julia C
Create a Home Valuation Report for This Property
The Home Valuation Report is an in-depth analysis detailing your home's value as well as a comparison with similar homes in the area
Home Values in the Area
Average Home Value in this Area
Purchase History
| Date | Buyer | Sale Price | Title Company |
|---|---|---|---|
| Chappell William E | $189,900 | None Available | |
| Walkup Angela M | $261,500 | None Available | |
| Whaley Ronald L | $160,000 | -- | |
| Hall Julia C | -- | -- | |
| Hall Jerry D | $11,500 | -- |
Source: Public Records
Mortgage History
| Date | Status | Borrower | Loan Amount |
|---|---|---|---|
| Open | Chappell William E | $196,166 | |
| Previous Owner | Walkup Angela M | $235,350 |
Source: Public Records
Tax History Compared to Growth
Tax History
| Year | Tax Paid | Tax Assessment Tax Assessment Total Assessment is a certain percentage of the fair market value that is determined by local assessors to be the total taxable value of land and additions on the property. | Land | Improvement |
|---|---|---|---|---|
| 2024 | $2,480 | $105,680 | $10,600 | $95,080 |
| 2023 | $2,130 | $90,120 | $10,600 | $79,520 |
| 2022 | $2,022 | $85,640 | $10,600 | $75,040 |
| 2021 | $1,881 | $79,440 | $10,600 | $68,840 |
| 2020 | $1,795 | $75,520 | $10,600 | $64,920 |
| 2019 | $1,795 | $75,520 | $10,600 | $64,920 |
| 2018 | $1,795 | $75,520 | $10,600 | $64,920 |
| 2017 | $1,796 | $75,520 | $10,600 | $64,920 |
| 2016 | $1,799 | $75,520 | $10,600 | $64,920 |
| 2015 | $1,803 | $75,520 | $10,600 | $64,920 |
| 2014 | -- | $75,520 | $10,600 | $64,920 |
| 2013 | -- | $75,520 | $10,600 | $64,920 |
Source: Public Records
Map
Nearby Homes
- 125 Surrey Place
- 2261 Us Highway 341 S
- 105 River Rock Ct
- 110 Golden Ingot Ct
- 101 Pridgen Pass
- 219 Ivy Glen Dr
- 218 Ivy Glen Dr
- 105 Ivy Glen Dr
- 115 Pridgen Pass
- Calloway 3 Express Plan at Remington Chase
- 108 Pridgen Pass
- 133 Worchester Cir
- 123 Pridgen Pass
- The Radiance Plan at Ivy Glen
- The Luna Plan at Ivy Glen
- 208 Ivy Glen Dr
- 0 Pridgen Pass Unit 10466225
- 0 Pridgen Pass Unit 251104
- 103 Gnome Ct
- 116 Wimbish Way
- 120 Wimbish Way
- 114 Wimbish Way
- 100 Wimbish E
- 113 Wimbish Way
- 176 Old Farm Rd
- 122 Wimbish Way
- 109 Wimbish Way
- 121 Wimbish Way
- 112 Wimbish Way
- 0 Wimbish Way
- 102 Wimbish E
- 124 Wimbish Way
- 110 Wimbish Way
- 123 Wimbish Way
- 104 Wimbish E
- 103 Wimbish E
- 322 Old Farm Rd
- 125 Wimbish Way
- 107 Wimbish Way