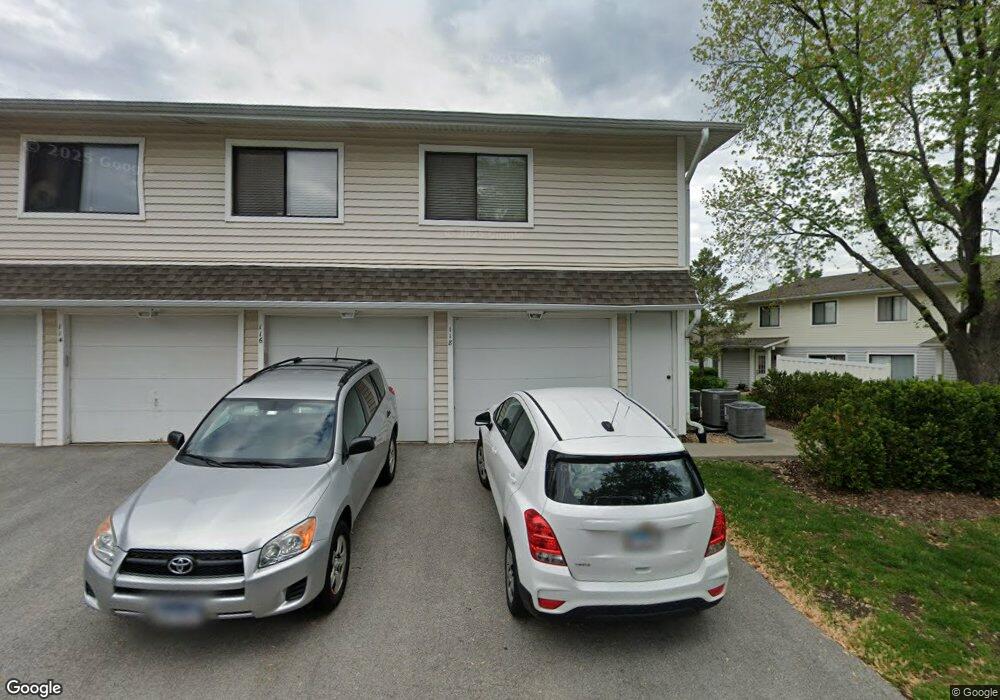
118 Windward Dr Unit 143D Schaumburg, IL 60194
East Schaumburg NeighborhoodEstimated Value: $229,119 - $291,000
2
Beds
--
Bath
1,100
Sq Ft
$238/Sq Ft
Est. Value
About This Home
This home is located at 118 Windward Dr Unit 143D, Schaumburg, IL 60194 and is currently estimated at $261,530, approximately $237 per square foot. 118 Windward Dr Unit 143D is a home located in Cook County with nearby schools including Everett Dirksen Elementary School, Robert Frost Junior High School, and J B Conant High School.
Ownership History
Date
Name
Owned For
Owner Type
Purchase Details
Closed on
May 28, 2012
Sold by
Trujillo Christine
Bought by
Ochab Janice
Current Estimated Value
Purchase Details
Closed on
Nov 20, 2000
Sold by
Bundalian Hernan
Bought by
Ochab William F
Home Financials for this Owner
Home Financials are based on the most recent Mortgage that was taken out on this home.
Original Mortgage
$96,000
Interest Rate
7.75%
Purchase Details
Closed on
Sep 22, 2000
Sold by
Santos Renato M
Bought by
Bundalian Hernan
Home Financials for this Owner
Home Financials are based on the most recent Mortgage that was taken out on this home.
Original Mortgage
$96,000
Interest Rate
7.75%
Purchase Details
Closed on
Sep 16, 1993
Sold by
Wolfard Antoinette D and Pelnar Antoinette D
Bought by
Santos Renato M
Home Financials for this Owner
Home Financials are based on the most recent Mortgage that was taken out on this home.
Original Mortgage
$71,725
Interest Rate
5.25%
Create a Home Valuation Report for This Property
The Home Valuation Report is an in-depth analysis detailing your home's value as well as a comparison with similar homes in the area
Home Values in the Area
Average Home Value in this Area
Purchase History
| Date | Buyer | Sale Price | Title Company |
|---|---|---|---|
| Ochab Janice | -- | None Available | |
| Ochab Janice | -- | None Available | |
| Ochab Janice | -- | None Available | |
| Ochab Janice | -- | None Available | |
| Ochab William F | $120,000 | -- | |
| Bundalian Hernan | $110,000 | -- | |
| Santos Renato M | $50,333 | -- |
Source: Public Records
Mortgage History
| Date | Status | Borrower | Loan Amount |
|---|---|---|---|
| Previous Owner | Ochab William F | $96,000 | |
| Previous Owner | Bundalian Hernan | $104,400 | |
| Previous Owner | Santos Renato M | $71,725 |
Source: Public Records
Tax History
| Year | Tax Paid | Tax Assessment Tax Assessment Total Assessment is a certain percentage of the fair market value that is determined by local assessors to be the total taxable value of land and additions on the property. | Land | Improvement |
|---|---|---|---|---|
| 2025 | $3,241 | $21,656 | $5,218 | $16,438 |
| 2024 | $3,241 | $17,537 | $5,566 | $11,971 |
| 2023 | $2,038 | $17,537 | $5,566 | $11,971 |
| 2022 | $2,038 | $17,537 | $5,566 | $11,971 |
| 2021 | $2,012 | $13,300 | $7,131 | $6,169 |
| 2020 | $3,038 | $13,300 | $7,131 | $6,169 |
| 2019 | $3,044 | $14,786 | $7,131 | $7,655 |
| 2018 | $2,486 | $11,719 | $6,000 | $5,719 |
| 2017 | $2,465 | $11,719 | $6,000 | $5,719 |
| 2016 | $2,547 | $11,719 | $6,000 | $5,719 |
| 2015 | $2,389 | $10,608 | $5,218 | $5,390 |
| 2014 | $2,379 | $10,608 | $5,218 | $5,390 |
| 2013 | $2,300 | $10,608 | $5,218 | $5,390 |
Source: Public Records
Map
Nearby Homes
- 631 Schooner Point Unit 106B
- 236 N Waterford Dr Unit 11B
- 601 Fairbanks Ct Unit V2
- 829 Heatherstone Dr
- 730 Lamorak Dr
- 101 Bar Harbour Rd Unit 2
- 321 Carmelhead Ln
- 1252 Beechwood Ct Unit 1C
- 132 Wolcott Ct Unit M1
- 52 Brookston Dr Unit D2
- 1223 Sandhurst Ct Unit D-1
- 1220 Plum Tree Ct Unit 2D
- 10 Waterbury Ln Unit M2
- 267 Northbury Ct Unit D2
- 151 Brookston Dr Unit A2
- 26 Waterbury Ln Unit N2
- 701 Preston Ln
- 310 Oak Meadow Ct Unit D2
- 1325 Williamsburg Dr Unit C1
- 745 Whalom Ln Unit 3A1
- 116 Windward Dr Unit 143C
- 114 Windward Dr Unit 143B
- 114 Windward Dr Unit B
- 114 Windward Dr Unit 114
- 112 Windward Dr Unit 143A
- 721 Sunfish Point Unit 142C
- 721 Sunfish Point
- 715 Sunfish Point Unit 141A
- 723 Sunfish Point Unit 142D
- 723 Sunfish Point Unit 723
- 717 Sunfish Point Unit 142A
- 719 Sunfish Point Unit 142B
- 110 Windward Dr Unit 137A
- 711 Sunfish Point Unit 141C
- 104 Windward Dr Unit 137D
- 713 Sunfish Point Unit 141B
- 108 Windward Dr Unit 137B
- 709 Sunfish Point Unit 141D
- 709 Sunfish Point Unit 709
- 729 Starboard Point Unit 144B
Your Personal Tour Guide
Ask me questions while you tour the home.