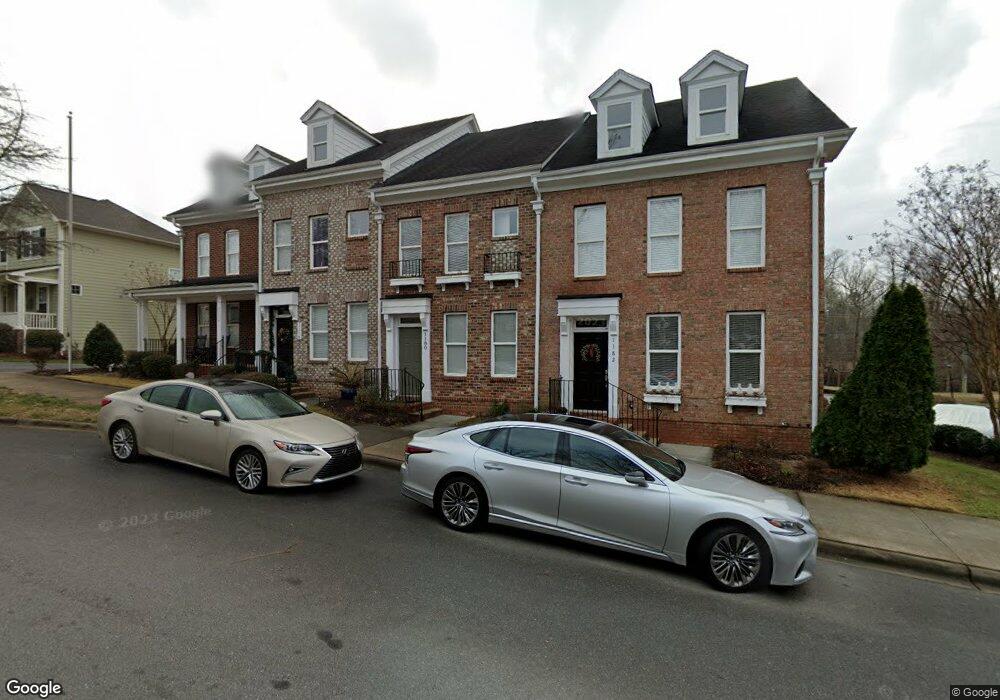
1180 Assembly St Unit 158 Belmont, NC 28012
Estimated Value: $323,870 - $335,000
2
Beds
3
Baths
1,178
Sq Ft
$281/Sq Ft
Est. Value
About This Home
This home is located at 1180 Assembly St Unit 158, Belmont, NC 28012 and is currently estimated at $330,968, approximately $280 per square foot. 1180 Assembly St Unit 158 is a home located in Gaston County with nearby schools including J B Page Elementary School, Belmont Central Elementary School, and Belmont Middle School.
Ownership History
Date
Name
Owned For
Owner Type
Purchase Details
Closed on
Jun 25, 2024
Sold by
Trudelle Bruce E and Trudelle Stacy A
Bought by
Taylor Payton W
Current Estimated Value
Home Financials for this Owner
Home Financials are based on the most recent Mortgage that was taken out on this home.
Original Mortgage
$256,000
Outstanding Balance
$252,960
Interest Rate
7.02%
Mortgage Type
New Conventional
Estimated Equity
$78,008
Purchase Details
Closed on
Oct 3, 2022
Sold by
Higgins Wright and Higgins Peter
Bought by
Trudelle Bruce E and Trudelle Stacy A
Purchase Details
Closed on
Sep 24, 2020
Sold by
Hunter Josh
Bought by
Wright Hannah and Wright Peter Higgins
Home Financials for this Owner
Home Financials are based on the most recent Mortgage that was taken out on this home.
Original Mortgage
$206,196
Interest Rate
2.9%
Mortgage Type
FHA
Purchase Details
Closed on
Jun 6, 2008
Sold by
Ms Eagle Park Llc
Bought by
Hunter Josh
Home Financials for this Owner
Home Financials are based on the most recent Mortgage that was taken out on this home.
Original Mortgage
$137,750
Interest Rate
6%
Mortgage Type
Purchase Money Mortgage
Create a Home Valuation Report for This Property
The Home Valuation Report is an in-depth analysis detailing your home's value as well as a comparison with similar homes in the area
Home Values in the Area
Average Home Value in this Area
Purchase History
| Date | Buyer | Sale Price | Title Company |
|---|---|---|---|
| Taylor Payton W | $320,000 | None Listed On Document | |
| Trudelle Bruce E | $305,000 | -- | |
| Wright Hannah | $220,000 | None Available | |
| Hunter Josh | $145,000 | None Available |
Source: Public Records
Mortgage History
| Date | Status | Borrower | Loan Amount |
|---|---|---|---|
| Open | Taylor Payton W | $256,000 | |
| Previous Owner | Wright Hannah | $206,196 | |
| Previous Owner | Hunter Josh | $137,750 |
Source: Public Records
Tax History Compared to Growth
Tax History
| Year | Tax Paid | Tax Assessment Tax Assessment Total Assessment is a certain percentage of the fair market value that is determined by local assessors to be the total taxable value of land and additions on the property. | Land | Improvement |
|---|---|---|---|---|
| 2025 | $2,707 | $256,800 | $38,000 | $218,800 |
| 2024 | $2,707 | $256,800 | $38,000 | $218,800 |
| 2023 | $2,735 | $256,800 | $38,000 | $218,800 |
| 2022 | $2,202 | $168,760 | $38,000 | $130,760 |
| 2021 | $2,270 | $168,760 | $38,000 | $130,760 |
| 2019 | $2,287 | $168,760 | $38,000 | $130,760 |
| 2018 | $2,009 | $145,026 | $28,000 | $117,026 |
| 2017 | $1,951 | $145,026 | $28,000 | $117,026 |
| 2016 | $1,951 | $145,026 | $0 | $0 |
| 2014 | $2,231 | $165,885 | $35,000 | $130,885 |
Source: Public Records
Map
Nearby Homes
- 2313 Blueberry St
- 1225 Assembly St
- 6033 Bountiful St Unit 201
- 6028 Bountiful St
- 321 Landers Way
- 337 Landers Way
- 138 Bella Way
- 1024 Garibaldi Ridge Ct
- 309 Oakland Ave
- 822 S Main St
- 800 Mark St
- 37 S Main St
- 10 Barnes Dr
- 0000 Elm St
- 203 Sacco St
- 12 Barnes Dr
- 24 Oak St
- 6022 Wilkinson Blvd
- 203 Todd St
- 529 Winding Way Unit 8
- 1180 Assembly St
- 1178 Assembly St
- 1178 Assembly St Unit 157
- 1182 Assembly St Unit 278
- 1176 Assembly St
- 2300 Blueberry St
- 1172 Assembly St
- 2304 Blueberry St
- 1166 Assembly St
- 2308 Blueberry St
- 2312 Blueberry St Unit 130
- 2312 Blueberry St
- 1160 Assembly St
- 2316 Blueberry St
- 2320 Blueberry St
- 1006 Bobbin Ln
- 1006 Bobbin Ln Unit 80
- 1154 Assembly St
- 2301 Blueberry St
- 1012 Bobbin Ln