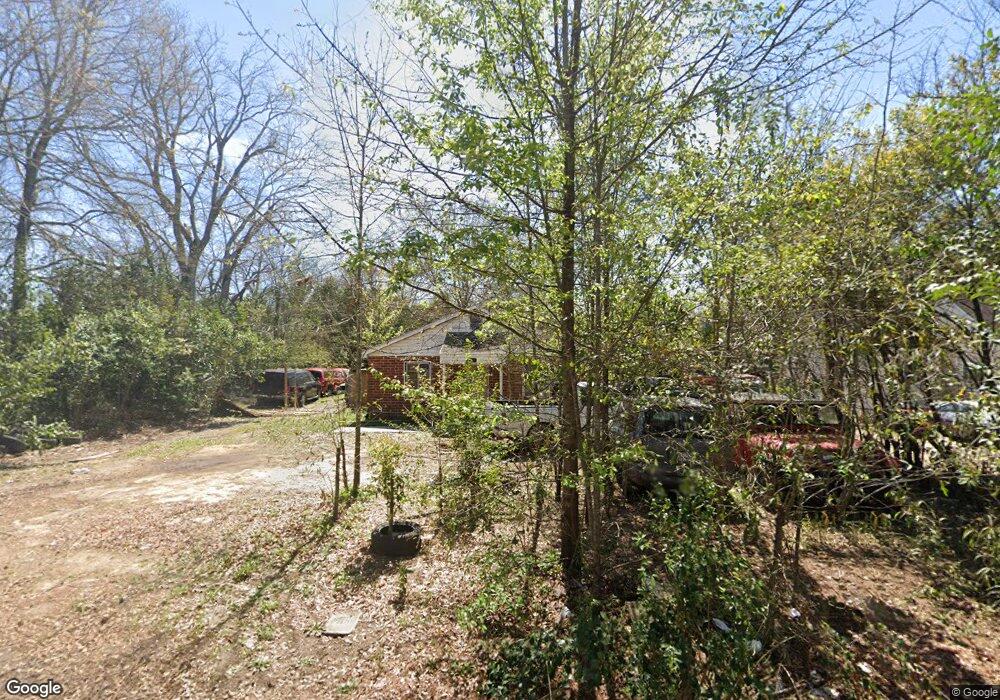
1180 Auburn Dr Macon, GA 31206
Estimated Value: $78,000 - $130,000
4
Beds
2
Baths
1,680
Sq Ft
$63/Sq Ft
Est. Value
About This Home
This home is located at 1180 Auburn Dr, Macon, GA 31206 and is currently estimated at $105,814, approximately $62 per square foot. 1180 Auburn Dr is a home located in Bibb County with nearby schools including Southfield Elementary School, Southwest High School, and Cirrus Charter Academy.
Ownership History
Date
Name
Owned For
Owner Type
Purchase Details
Closed on
Oct 19, 2017
Sold by
Clark Sheddrick L
Bought by
Pretty Wings Enterprises Inc
Current Estimated Value
Purchase Details
Closed on
Aug 5, 2013
Sold by
State Bank And Trust Co
Bought by
Clark Sheddrick L
Purchase Details
Closed on
Nov 6, 2012
Sold by
Denson Joe B
Bought by
State Bank And Trust Co
Purchase Details
Closed on
Oct 4, 2012
Sold by
Denson Joe B
Bought by
State Bank And Trust Company
Purchase Details
Closed on
Dec 21, 2009
Sold by
Denson Joe B
Bought by
Sister'S & Sister'S Assoc Lp
Purchase Details
Closed on
Oct 31, 2008
Sold by
Levine Michael
Bought by
Denson Joe B
Purchase Details
Closed on
Nov 22, 2006
Sold by
Allstate Home Equity Corp
Bought by
Levine Michael
Purchase Details
Closed on
Nov 2, 2006
Sold by
Allstate Home Equity Corp
Bought by
Berryman W C
Create a Home Valuation Report for This Property
The Home Valuation Report is an in-depth analysis detailing your home's value as well as a comparison with similar homes in the area
Purchase History
| Date | Buyer | Sale Price | Title Company |
|---|---|---|---|
| Pretty Wings Enterprises Inc | -- | None Available | |
| Clark Sheddrick L | $1,100 | None Available | |
| State Bank And Trust Co | $14,000 | None Available | |
| State Bank And Trust Company | $30,000 | -- | |
| Sister'S & Sister'S Assoc Lp | -- | -- | |
| Denson Joe B | $82,700 | None Available | |
| Levine Michael | $43,000 | None Avilabale | |
| Berryman W C | $38,000 | None Available | |
| Allstate Home Equity Corp | $40,000 | None Available |
Source: Public Records
Tax History
| Year | Tax Paid | Tax Assessment Tax Assessment Total Assessment is a certain percentage of the fair market value that is determined by local assessors to be the total taxable value of land and additions on the property. | Land | Improvement |
|---|---|---|---|---|
| 2025 | $572 | $23,292 | $2,675 | $20,617 |
| 2024 | $553 | $21,755 | $3,200 | $18,555 |
| 2023 | $644 | $21,755 | $3,200 | $18,555 |
| 2022 | $1,546 | $10,885 | $1,563 | $9,322 |
| 2021 | $1,382 | $8,778 | $1,407 | $7,371 |
| 2020 | $265 | $6,827 | $1,407 | $5,420 |
| 2019 | $267 | $6,827 | $1,407 | $5,420 |
| 2018 | $1,106 | $6,436 | $1,016 | $5,420 |
| 2017 | $359 | $9,582 | $1,016 | $8,566 |
| 2016 | $364 | $10,517 | $1,094 | $9,423 |
| 2015 | $515 | $10,517 | $1,094 | $9,423 |
| 2014 | $25 | $10,517 | $1,094 | $9,423 |
Source: Public Records
Map
Nearby Homes
- 1213 Auburn Dr
- 1250 Schley St
- 1211 Schley St
- 1113 Schley St
- 1317 Peavy Dr
- 1320 Peavy Dr
- 1207 Hartley St
- 4409 Mikado Ave
- 912 Thomas St
- 4385 Mikado Ave
- 1341 Glendale Ave
- 4386 Mikado Ave
- 1216 Buena Vista Ave
- 4209 Capitol Ave
- 4235 Mikado Ave
- 1239 Hillridge Dr
- 4195 Mikado Ave
- 4142 Buena Vista Ave
- 4305 Marion Ave
- 4301 Marion Ave
- 1198 Auburn Dr
- 1226 Auburn Dr
- 1181 Auburn Dr
- 1167 Auburn Dr
- 1195 Auburn Dr
- 1153 Auburn Dr
- 1250 Auburn Dr
- 1139 Auburn Dr
- 1227 Auburn Dr
- 1125 Auburn Dr
- 1241 Auburn Dr
- 4461 Houston Ave Unit 194
- 4461 Houston Ave
- 1182 Schley St
- 1111 Auburn Dr
- 1168 Schley St
- 1196 Schley St
- 1260 Auburn Dr
- 1154 Schley St
- 1214 Schley St
Your Personal Tour Guide
Ask me questions while you tour the home.