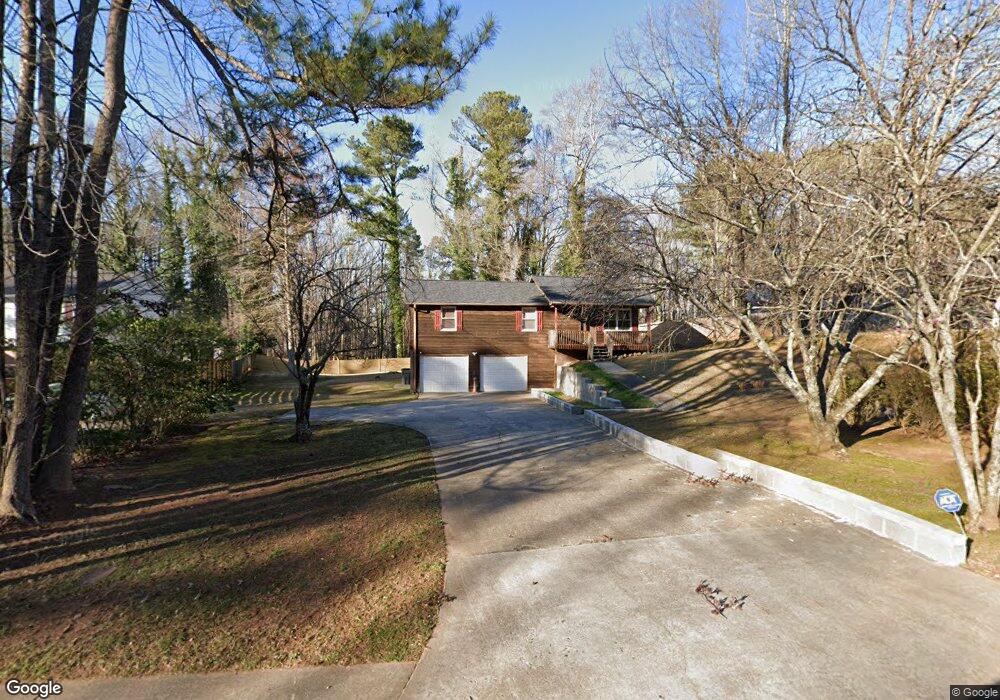
1180 Clay Rd SW Mableton, GA 30126
Estimated Value: $232,201 - $275,000
3
Beds
2
Baths
1,144
Sq Ft
$230/Sq Ft
Est. Value
About This Home
This home is located at 1180 Clay Rd SW, Mableton, GA 30126 and is currently estimated at $262,800, approximately $229 per square foot. 1180 Clay Rd SW is a home located in Cobb County with nearby schools including Deerwood Elementary School, Mableton Elementary School, and Floyd Middle School.
Ownership History
Date
Name
Owned For
Owner Type
Purchase Details
Closed on
May 14, 2024
Sold by
Burks Lolita and Kennedy Lolita
Bought by
Burks Lolita
Current Estimated Value
Purchase Details
Closed on
Dec 6, 2001
Sold by
Sec Of Hud
Bought by
Kennedy Lolita
Home Financials for this Owner
Home Financials are based on the most recent Mortgage that was taken out on this home.
Original Mortgage
$107,648
Interest Rate
6.5%
Mortgage Type
New Conventional
Purchase Details
Closed on
Jun 5, 2001
Sold by
Homeside Lending Inc
Bought by
Sec Of Hud
Purchase Details
Closed on
Jun 13, 1997
Sold by
Murphy Patrick R and Murphy Lyn E
Bought by
Allen Fredrica M
Home Financials for this Owner
Home Financials are based on the most recent Mortgage that was taken out on this home.
Original Mortgage
$87,832
Interest Rate
7.97%
Mortgage Type
FHA
Create a Home Valuation Report for This Property
The Home Valuation Report is an in-depth analysis detailing your home's value as well as a comparison with similar homes in the area
Home Values in the Area
Average Home Value in this Area
Purchase History
| Date | Buyer | Sale Price | Title Company |
|---|---|---|---|
| Burks Lolita | -- | None Listed On Document | |
| Kennedy Lolita | -- | -- | |
| Sec Of Hud | -- | -- | |
| Homeside Lending Inc | $104,000 | -- | |
| Allen Fredrica M | $89,900 | -- |
Source: Public Records
Mortgage History
| Date | Status | Borrower | Loan Amount |
|---|---|---|---|
| Previous Owner | Kennedy Lolita | $107,648 | |
| Previous Owner | Allen Fredrica M | $87,832 |
Source: Public Records
Tax History Compared to Growth
Tax History
| Year | Tax Paid | Tax Assessment Tax Assessment Total Assessment is a certain percentage of the fair market value that is determined by local assessors to be the total taxable value of land and additions on the property. | Land | Improvement |
|---|---|---|---|---|
| 2025 | $1,827 | $83,888 | $29,752 | $54,136 |
| 2024 | $1,828 | $83,888 | $29,752 | $54,136 |
| 2023 | $1,001 | $70,780 | $32,884 | $37,896 |
| 2022 | $1,335 | $60,672 | $28,188 | $32,484 |
| 2021 | $1,273 | $57,864 | $26,620 | $31,244 |
| 2020 | $1,136 | $51,600 | $20,356 | $31,244 |
| 2019 | $1,136 | $51,600 | $20,356 | $31,244 |
| 2018 | $884 | $40,060 | $10,960 | $29,100 |
| 2017 | $848 | $40,060 | $10,960 | $29,100 |
| 2016 | $783 | $37,040 | $9,396 | $27,644 |
| 2015 | $797 | $36,768 | $9,396 | $27,372 |
| 2014 | $803 | $36,768 | $0 | $0 |
Source: Public Records
Map
Nearby Homes
- 1275 Clay Rd SW
- 1056 Retner Dr SW Unit 3
- 4397 Treadle Rd SW
- 1047 Retner Dr SW
- 4976 Mable Lake Dr SW
- 0 Brookwood Dr Unit 7577066
- 0 Brookwood Dr Unit 10519191
- 1440 Compton Dr SW
- 5205 Silhouette Ln SW
- 854 Joseph Club Dr SW
- 875 Joseph Club Dr SW
- 5527 Andrew Dr SW
- 4938 White Blvd SW
- 4556 Sweetlake Rd SW
- 8009 Haven Springs Trace
- 8029 Haven Springs Trace
- 8025 Haven Springs Trace
- 8041 Haven Springs Trace
- 1184 Clay Rd SW
- 1150 Clay Rd SW Unit 1
- 1150 Clay Rd SW Unit 2
- 1150 Clay Rd SW
- 1190 Clay Rd SW
- 1191 Clay Rd SW
- 1180 Deborah Dr SW
- 0 Clay Rd SW Unit 10383943
- 0 Clay Rd SW Unit 7460886
- 0 Clay Rd SW Unit 7468433
- 0 Clay Rd SW Unit 8302635
- 0 Clay Rd SW Unit 8282237
- 0 Clay Rd SW Unit 8137203
- 0 Clay Rd SW Unit 8041387
- 0 Clay Rd SW Unit 7064449
- 0 Clay Rd SW Unit 8467742
- 0 Clay Rd SW Unit 3290413
- 0 Clay Rd SW Unit 3129940
- 0 Clay Rd SW Unit 8078532
- 0 Clay Rd SW Unit 8344483