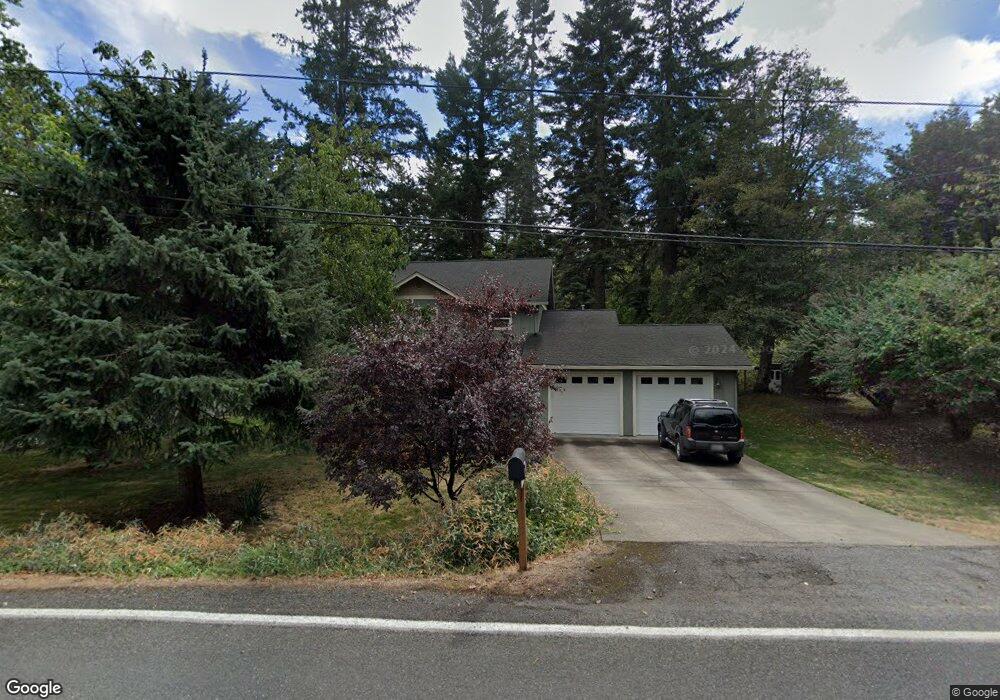
1180 SW Ryan Allen Rd Stevenson, WA 98648
Estimated Value: $608,936 - $682,000
3
Beds
2
Baths
1,736
Sq Ft
$374/Sq Ft
Est. Value
About This Home
This home is located at 1180 SW Ryan Allen Rd, Stevenson, WA 98648 and is currently estimated at $649,734, approximately $374 per square foot. 1180 SW Ryan Allen Rd is a home located in Skamania County with nearby schools including Stevenson Elementary School, Carson Elementary School, and Wind River Middle School.
Ownership History
Date
Name
Owned For
Owner Type
Purchase Details
Closed on
Oct 24, 2010
Sold by
Cross Shayne G and Cross Grace D
Bought by
Cross Shayne G and Cross Graciela D
Current Estimated Value
Home Financials for this Owner
Home Financials are based on the most recent Mortgage that was taken out on this home.
Original Mortgage
$251,995
Outstanding Balance
$166,121
Interest Rate
4.33%
Mortgage Type
New Conventional
Estimated Equity
$483,613
Purchase Details
Closed on
May 23, 2008
Sold by
Cross Grace D and Cross Shayne G
Bought by
Cross Shayne G and Corss Grace D
Home Financials for this Owner
Home Financials are based on the most recent Mortgage that was taken out on this home.
Original Mortgage
$249,874
Interest Rate
5.87%
Mortgage Type
FHA
Purchase Details
Closed on
Oct 9, 2006
Sold by
Skaar Evelyn L
Bought by
Cross Shayne G and Cross Grace D
Create a Home Valuation Report for This Property
The Home Valuation Report is an in-depth analysis detailing your home's value as well as a comparison with similar homes in the area
Home Values in the Area
Average Home Value in this Area
Purchase History
| Date | Buyer | Sale Price | Title Company |
|---|---|---|---|
| Cross Shayne G | -- | Skamania County Title Compan | |
| Cross Shayne G | -- | Skamania County Title Compan | |
| Cross Shayne G | -- | None Available |
Source: Public Records
Mortgage History
| Date | Status | Borrower | Loan Amount |
|---|---|---|---|
| Open | Cross Shayne G | $251,995 | |
| Closed | Cross Shayne G | $249,874 |
Source: Public Records
Tax History Compared to Growth
Tax History
| Year | Tax Paid | Tax Assessment Tax Assessment Total Assessment is a certain percentage of the fair market value that is determined by local assessors to be the total taxable value of land and additions on the property. | Land | Improvement |
|---|---|---|---|---|
| 2025 | $4,263 | $526,200 | $124,100 | $402,100 |
| 2024 | $4,026 | $481,300 | $115,500 | $365,800 |
| 2023 | $3,854 | $433,700 | $100,500 | $333,200 |
| 2022 | $3,889 | $384,700 | $85,500 | $299,200 |
| 2021 | $3,589 | $304,700 | $83,500 | $221,200 |
| 2020 | $3,159 | $304,700 | $83,500 | $221,200 |
| 2019 | $2,580 | $272,500 | $73,500 | $199,000 |
| 2018 | $2,880 | $267,500 | $68,500 | $199,000 |
| 2017 | $2,171 | $249,400 | $68,500 | $180,900 |
| 2015 | $2,424 | $249,400 | $68,500 | $180,900 |
| 2013 | -- | $245,000 | $68,500 | $176,500 |
Source: Public Records
Map
Nearby Homes
- 1225 SW Ryan Allen Rd
- 1090 SW Briggs St
- 85 SW Monda Rd
- 960 NW Angel Heights Rd
- 189 NW Falcon Ct
- 531 NW Vancouver Ave
- 541 NW Vancouver Ave
- 79 NW Lasher St
- 472 NW Hot Springs Alameda Rd
- 0 School St Unit Lot 15 562048157
- 260 NW Stone Brooke Ct
- 270 NW Bulldog Dr
- 000 NW School (Lot 2 Land) Rd Unit 2
- 404 Lutheran Church Rd
- 344 Lutheran Church Rd
- 145 NE Upper Basso Cir
- 154 NE Upper Basso Cir
- 147 NE Bruce Heights Unit 65
- 220 NE Lower Basso Cir
- 243 NE Hemmingway Dr
- 1227 SW Ryan Allen Rd
- 1165 SW Ryan Allen Rd
- 1160 SW Ryan Allen Rd
- 1145 SW Ryan Allen Rd
- 1050 SW Ryan Allen Rd
- 360 SW Foster Creek Rd
- 325 SW Ryan Allen Rd
- 307 SW Atwell Rd
- 231 SW Atwell Rd
- 289 SW Atwell Rd
- 289 SW Attwell Rd
- 366 SW Foster Creek Rd
- 221 SW Atwell Rd
- 1080 SW Briggs St
- 305 SW Atwell Rd
- 1030 SW Ryan Allen Rd
- 0 Skaar Woof
- 280 SW Atwell Rd
- 315 SW Atwell Rd
- 1025 SW Ryan Allen Rd