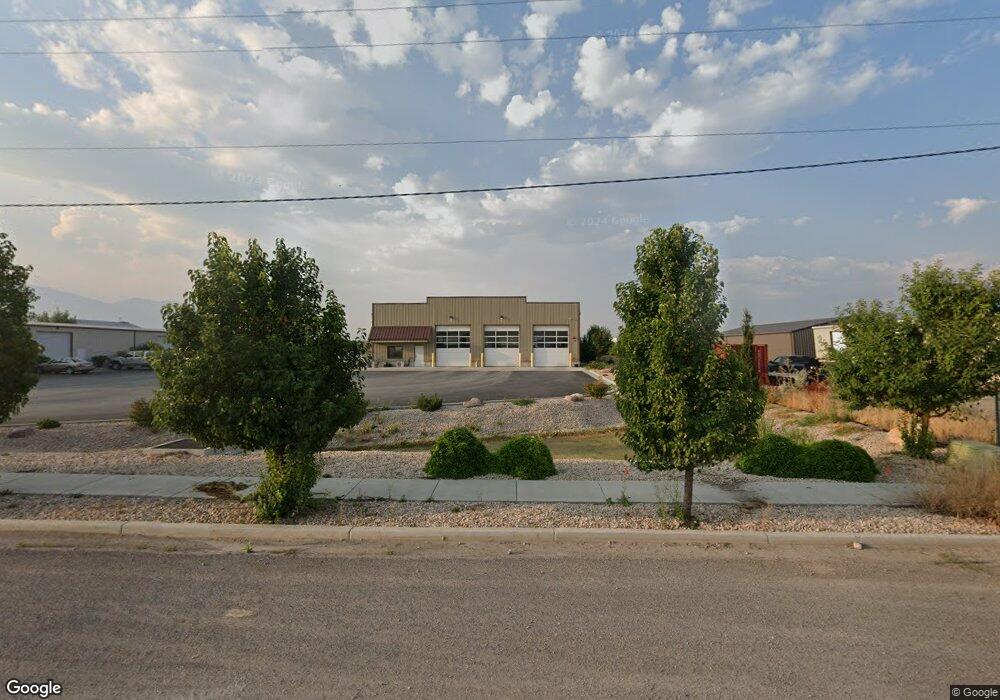
1180 W 600 N Logan, UT 84321
Ellis NeighborhoodEstimated Value: $843,000
--
Bed
--
Bath
7,000
Sq Ft
$120/Sq Ft
Est. Value
About This Home
This home is located at 1180 W 600 N, Logan, UT 84321 and is currently estimated at $843,000, approximately $120 per square foot. 1180 W 600 N is a home located in Cache County with nearby schools including Ellis School, Mount Logan Middle School, and Logan High School.
Ownership History
Date
Name
Owned For
Owner Type
Purchase Details
Closed on
Dec 20, 2017
Sold by
Milk Money Trucking Inc
Bought by
Milk Money Properties Llc
Current Estimated Value
Home Financials for this Owner
Home Financials are based on the most recent Mortgage that was taken out on this home.
Original Mortgage
$347,000
Outstanding Balance
$291,841
Interest Rate
3.9%
Mortgage Type
New Conventional
Estimated Equity
$551,159
Purchase Details
Closed on
Nov 20, 2015
Sold by
Crest Investments Lc
Bought by
Milk Money Trucking Inc
Home Financials for this Owner
Home Financials are based on the most recent Mortgage that was taken out on this home.
Original Mortgage
$105,000
Interest Rate
3.73%
Mortgage Type
Purchase Money Mortgage
Purchase Details
Closed on
May 24, 2002
Sold by
Dodgen Don
Bought by
Crest Investments Lc
Create a Home Valuation Report for This Property
The Home Valuation Report is an in-depth analysis detailing your home's value as well as a comparison with similar homes in the area
Home Values in the Area
Average Home Value in this Area
Purchase History
| Date | Buyer | Sale Price | Title Company |
|---|---|---|---|
| Milk Money Properties Llc | -- | -- | |
| Milk Money Trucking Inc | -- | Advanced Title | |
| Crest Investments Lc | -- | Hickman Land Title Company |
Source: Public Records
Mortgage History
| Date | Status | Borrower | Loan Amount |
|---|---|---|---|
| Open | Milk Money Properties Llc | $347,000 | |
| Previous Owner | Milk Money Trucking Inc | $105,000 |
Source: Public Records
Tax History Compared to Growth
Tax History
| Year | Tax Paid | Tax Assessment Tax Assessment Total Assessment is a certain percentage of the fair market value that is determined by local assessors to be the total taxable value of land and additions on the property. | Land | Improvement |
|---|---|---|---|---|
| 2024 | $7,317 | $916,569 | $301,356 | $615,213 |
| 2023 | $6,762 | $807,386 | $287,006 | $520,380 |
| 2022 | $7,119 | $793,719 | $273,339 | $520,380 |
| 2021 | $6,633 | $628,436 | $132,836 | $495,600 |
| 2020 | $7,370 | $628,436 | $132,836 | $495,600 |
| 2019 | $7,620 | $621,636 | $132,836 | $488,800 |
| 2018 | $2,253 | $167,836 | $132,836 | $35,000 |
| 2017 | $1,855 | $132,835 | $0 | $0 |
| 2016 | $1,923 | $154,145 | $0 | $0 |
| 2015 | $2,399 | $165,470 | $0 | $0 |
| 2014 | $2,168 | $165,470 | $0 | $0 |
| 2013 | -- | $165,470 | $0 | $0 |
Source: Public Records
Map
Nearby Homes
- 1140 W 600 N
- 3138 S 1500 W
- 1065 W 600 N
- 1045 W 500 N
- 1125 W 400 N
- 1125 W 400 N Unit 18
- 1125 W 400 N Unit 19
- 1125 W 400 N Unit 20
- 1125 W 400 N Unit 16
- 1125 W 400 N Unit 17
- 1125 W 400 N Unit 150
- 1125 W 400 N Unit 170
- 1125 W 400 N Unit 240
- 1125 W 400 N Unit 230
- 1125 W 400 N Unit 280
- 1125 W 400 N Unit 190
- 1125 W 400 N Unit 180
- 1125 W 400 N Unit 200
- 1364 W 600 N
- 1011 W 400 N