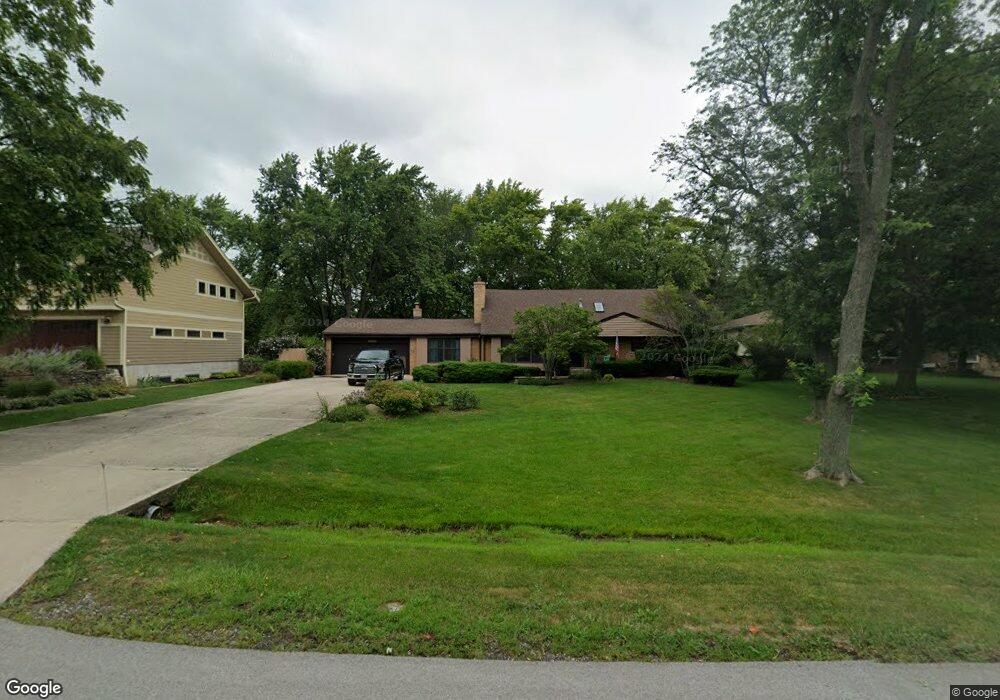
11800 Stephanie Ln Mokena, IL 60448
Estimated Value: $365,000 - $430,000
3
Beds
4
Baths
2,278
Sq Ft
$177/Sq Ft
Est. Value
About This Home
This home is located at 11800 Stephanie Ln, Mokena, IL 60448 and is currently estimated at $404,133, approximately $177 per square foot. 11800 Stephanie Ln is a home located in Will County with nearby schools including Mokena Elementary School, Mokena Intermediate School, and Mokena Jr High School.
Ownership History
Date
Name
Owned For
Owner Type
Purchase Details
Closed on
Nov 30, 2023
Sold by
John A Scurrah A and John Deborah A
Bought by
Otoole James D and Otoole Kayley M
Current Estimated Value
Home Financials for this Owner
Home Financials are based on the most recent Mortgage that was taken out on this home.
Original Mortgage
$224,000
Outstanding Balance
$220,282
Interest Rate
7.5%
Mortgage Type
New Conventional
Estimated Equity
$183,851
Purchase Details
Closed on
Sep 28, 2020
Sold by
Scurrah John A and Scurrah Deborah
Bought by
Scurrah John A and Scurrah Deborah A
Purchase Details
Closed on
Aug 28, 1994
Sold by
Scurrah John A
Bought by
Scurrah John A and Scurrah Deborah
Purchase Details
Closed on
Jul 29, 1994
Sold by
Scurrah Katherine and Hanner Katherine
Bought by
Scurrah John A
Create a Home Valuation Report for This Property
The Home Valuation Report is an in-depth analysis detailing your home's value as well as a comparison with similar homes in the area
Home Values in the Area
Average Home Value in this Area
Purchase History
| Date | Buyer | Sale Price | Title Company |
|---|---|---|---|
| Otoole James D | $355,000 | None Listed On Document | |
| Scurrah John A | -- | None Available | |
| Scurrah John A | -- | -- | |
| Scurrah John A | -- | -- |
Source: Public Records
Mortgage History
| Date | Status | Borrower | Loan Amount |
|---|---|---|---|
| Open | Otoole James D | $224,000 |
Source: Public Records
Tax History
| Year | Tax Paid | Tax Assessment Tax Assessment Total Assessment is a certain percentage of the fair market value that is determined by local assessors to be the total taxable value of land and additions on the property. | Land | Improvement |
|---|---|---|---|---|
| 2024 | $7,419 | $116,505 | $22,059 | $94,446 |
| 2023 | $7,419 | $104,050 | $19,701 | $84,349 |
| 2022 | $6,621 | $94,772 | $17,944 | $76,828 |
| 2021 | $5,812 | $88,663 | $16,787 | $71,876 |
| 2020 | $5,866 | $86,164 | $16,314 | $69,850 |
| 2019 | $6,248 | $83,858 | $15,877 | $67,981 |
| 2018 | $6,036 | $81,448 | $15,421 | $66,027 |
| 2017 | $5,922 | $79,547 | $15,061 | $64,486 |
| 2016 | $5,754 | $76,820 | $14,545 | $62,275 |
| 2015 | $5,474 | $74,115 | $14,033 | $60,082 |
| 2014 | $5,474 | $73,599 | $13,935 | $59,664 |
| 2013 | $5,474 | $74,554 | $14,116 | $60,438 |
Source: Public Records
Map
Nearby Homes
- W Maple Rd
- 11617 Parkside Ln
- 12050 Josephine Dr
- 12002 Ashbrook Ln
- 19502 116th Ave Unit C
- 11254 192nd St
- 18728 S Mill Creek Dr
- 12165 W Castle Dr
- 19511 116th Ave Unit D
- 19545 116th Ave Unit A
- 19539 116th Ave Unit B
- 12351 W Warren Dr
- 19380 Wolf Rd Unit 6
- 11608 197th St
- 11040 Bryant Rd
- 11321 1st St
- 11325 1st St
- 11317 1st St
- 11329 1st St
- 11319 1st St
- 11810 Stephanie Ln
- 11760 Stephanie Ln
- 19000 Leila Dr
- 19013 Jean Rd
- 18954 Leila Dr
- 18967 S Jean Rd
- 11753 Stephanie Ln
- 18951 Jean Rd
- 11923 Stephanie Ln
- 11801 Stephanie Ln
- 11813 Stephanie Ln
- 18941 Jean Rd
- 19001 Leila Dr
- 18942 Leila Dr
- 19049 Jean Rd
- 11842 Stephanie Ln
- 11733 Stephanie Ln
- 18953 S Leila Dr
- 18953 S Leila Dr
- 11843 Stephanie Ln
Your Personal Tour Guide
Ask me questions while you tour the home.