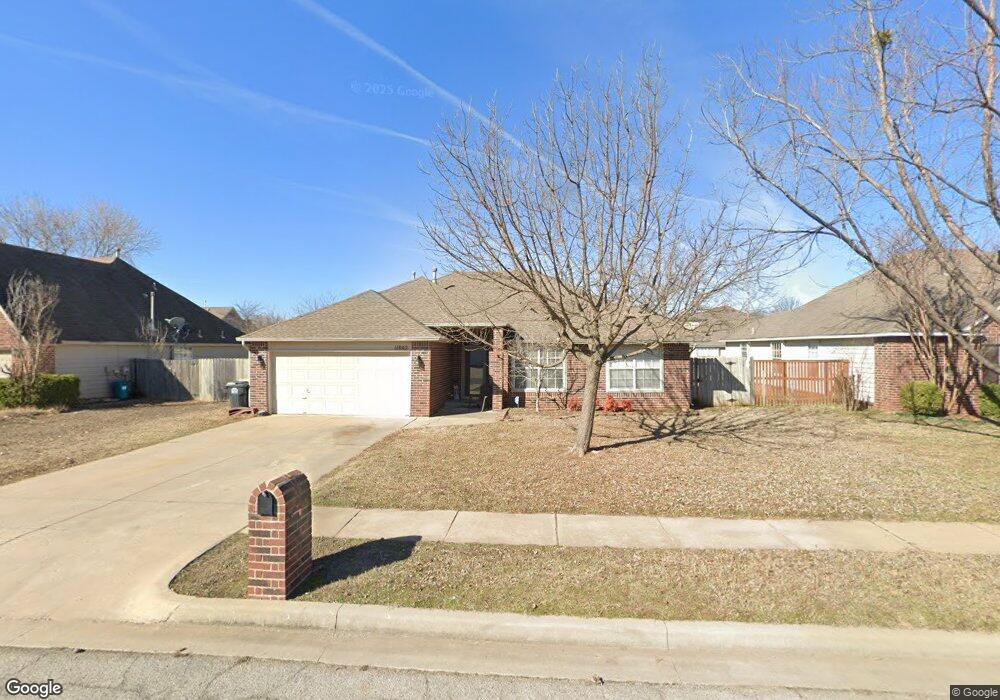
11802 S 104th East Ave Bixby, OK 74008
North Bixby NeighborhoodEstimated Value: $254,000 - $276,000
4
Beds
2
Baths
1,526
Sq Ft
$174/Sq Ft
Est. Value
About This Home
This home is located at 11802 S 104th East Ave, Bixby, OK 74008 and is currently estimated at $265,243, approximately $173 per square foot. 11802 S 104th East Ave is a home located in Tulsa County with nearby schools including Bixby East Elementary, Bixby Middle School, and Bixby High School.
Ownership History
Date
Name
Owned For
Owner Type
Purchase Details
Closed on
Nov 5, 2009
Sold by
Murray John Kyle and Murray Shelly D
Bought by
Dandridge Properties Llc
Current Estimated Value
Home Financials for this Owner
Home Financials are based on the most recent Mortgage that was taken out on this home.
Original Mortgage
$80,000
Interest Rate
5.03%
Mortgage Type
Purchase Money Mortgage
Purchase Details
Closed on
Mar 24, 2003
Sold by
Murphy Scott J and Murphy Cindy A
Bought by
Murray John Kyle
Purchase Details
Closed on
Sep 30, 2002
Sold by
Davis Stephen K and Davis Kristi L
Bought by
Murphy Scott J
Purchase Details
Closed on
Aug 24, 2000
Sold by
Rex Alexander Enterprises Inc
Bought by
Davis Stephen K
Home Financials for this Owner
Home Financials are based on the most recent Mortgage that was taken out on this home.
Original Mortgage
$80,000
Interest Rate
8.15%
Mortgage Type
Purchase Money Mortgage
Create a Home Valuation Report for This Property
The Home Valuation Report is an in-depth analysis detailing your home's value as well as a comparison with similar homes in the area
Home Values in the Area
Average Home Value in this Area
Purchase History
| Date | Buyer | Sale Price | Title Company |
|---|---|---|---|
| Dandridge Properties Llc | $142,000 | Oklahoma Title & Escrow Corp | |
| Murray John Kyle | $122,000 | Tulsa Abstract & Title Co | |
| Murphy Scott J | $119,000 | Tulsa Abstract & Title Co | |
| Davis Stephen K | $110,500 | Meridian Title & Closings In |
Source: Public Records
Mortgage History
| Date | Status | Borrower | Loan Amount |
|---|---|---|---|
| Closed | Dandridge Properties Llc | $80,000 | |
| Previous Owner | Davis Stephen K | $80,000 |
Source: Public Records
Tax History Compared to Growth
Tax History
| Year | Tax Paid | Tax Assessment Tax Assessment Total Assessment is a certain percentage of the fair market value that is determined by local assessors to be the total taxable value of land and additions on the property. | Land | Improvement |
|---|---|---|---|---|
| 2024 | $2,530 | $18,986 | $1,899 | $17,087 |
| 2023 | $2,530 | $18,082 | $1,930 | $16,152 |
| 2022 | $2,420 | $17,221 | $2,460 | $14,761 |
| 2021 | $2,154 | $16,401 | $2,343 | $14,058 |
| 2020 | $2,064 | $15,620 | $2,468 | $13,152 |
| 2019 | $2,072 | $15,620 | $2,468 | $13,152 |
| 2018 | $2,053 | $15,620 | $2,468 | $13,152 |
| 2017 | $2,040 | $15,620 | $2,468 | $13,152 |
| 2016 | $2,015 | $15,620 | $2,468 | $13,152 |
| 2015 | $1,927 | $15,620 | $2,468 | $13,152 |
| 2014 | $1,924 | $15,620 | $2,468 | $13,152 |
Source: Public Records
Map
Nearby Homes
- 12509 S 102nd East Ave
- 15404 S 34th East Ave
- 11631 S 103rd East Ave
- 11612 S 101st East Ave
- 11611 S 100th East Ave
- 9907 E 118th St S
- 13114 S 100th East Ave
- 9905 E 117th Place S
- 9923 E 119th Place S
- 10306 E 114th Place S
- 10842 E 115th Place S
- 13456 S 101st East Ave
- 13506 S 101st Ave E
- 12215 S 99th East Ave
- 9617 E 119th St S
- 9613 E 119th Ct S
- 12233 S 102nd East Ave
- 11318 S 108th East Place
- 11306 S 108th East Ave
- 9521 E 117th St S
- 11732 S 104th East Ave
- 11808 S 104th East Ave
- 11801 S 103rd East Ave
- 11733 S 103rd East Ave
- 11807 S 103rd East Ave
- 11726 S 104th East Ave
- 11812 S 104th East Ave
- 11803 S 104th East Ave
- 11809 S 104th East Ave
- 11731 S 104th East Ave
- 11811 S 103rd East Ave
- 11727 S 103rd East Ave
- 11722 S 104th East Ave
- 11725 S 104th East Ave
- 11813 S 104th East Ave
- 11723 S 103rd East Ave
- 15444 S 34th East Ave
- 3404 E 155th St S
- 3505 E 155th St S
- 12515 S 102nd East Ave