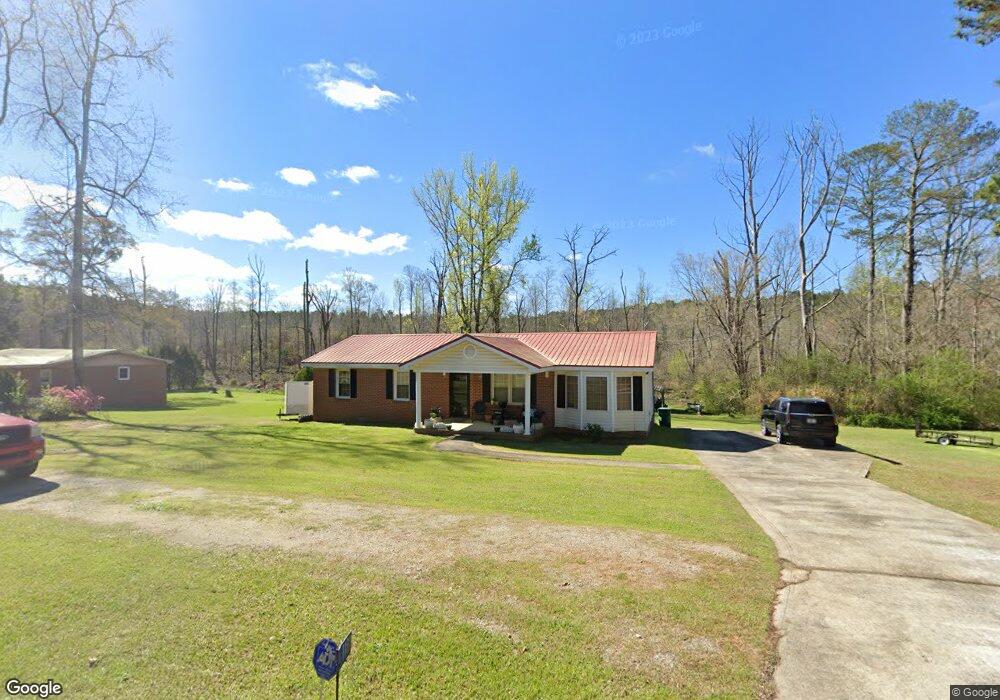
1181 Green Acres Dr Union Point, GA 30669
Estimated Value: $171,000 - $211,000
3
Beds
2
Baths
1,337
Sq Ft
$144/Sq Ft
Est. Value
About This Home
This home is located at 1181 Green Acres Dr, Union Point, GA 30669 and is currently estimated at $192,380, approximately $143 per square foot. 1181 Green Acres Dr is a home located in Greene County with nearby schools including Greene County High School.
Ownership History
Date
Name
Owned For
Owner Type
Purchase Details
Closed on
Feb 21, 2001
Sold by
Campbell Richard R
Bought by
Campbell Richard and Campbell Katrina D
Current Estimated Value
Purchase Details
Closed on
Jun 23, 1992
Sold by
Farmers Home Adm
Bought by
Campbell Richard R
Purchase Details
Closed on
Dec 21, 1990
Sold by
Nesbitt Jean and Nesbitt Jane
Bought by
Farmers Home Adm
Purchase Details
Closed on
Jan 1, 1984
Sold by
Farmers Home Adm
Bought by
Nesbitt Jean and Nesbitt Jane
Purchase Details
Closed on
Jan 1, 1983
Sold by
Chester Lonnie C and Chester Janice D
Bought by
Farmers Home Adm
Purchase Details
Closed on
Jan 1, 1977
Sold by
Wilson William R
Bought by
Chester Lonnie C and Chester Janice D
Purchase Details
Closed on
Jan 1, 1976
Sold by
Wilson William R
Bought by
Wilson William R
Purchase Details
Closed on
Jan 1, 1975
Sold by
Bentley-Whitfield Proper
Bought by
Mauldin Larry
Purchase Details
Closed on
Jan 1, 1972
Bought by
Bentley-Whitfield Proper
Create a Home Valuation Report for This Property
The Home Valuation Report is an in-depth analysis detailing your home's value as well as a comparison with similar homes in the area
Home Values in the Area
Average Home Value in this Area
Purchase History
| Date | Buyer | Sale Price | Title Company |
|---|---|---|---|
| Campbell Richard | -- | -- | |
| Campbell Richard R | $28,000 | -- | |
| Farmers Home Adm | -- | -- | |
| Nesbitt Jean | -- | -- | |
| Farmers Home Adm | -- | -- | |
| Chester Lonnie C | -- | -- | |
| Wilson William R | -- | -- | |
| Mauldin Larry | -- | -- | |
| Bentley-Whitfield Proper | -- | -- |
Source: Public Records
Tax History Compared to Growth
Tax History
| Year | Tax Paid | Tax Assessment Tax Assessment Total Assessment is a certain percentage of the fair market value that is determined by local assessors to be the total taxable value of land and additions on the property. | Land | Improvement |
|---|---|---|---|---|
| 2024 | $682 | $58,800 | $8,800 | $50,000 |
| 2023 | $395 | $56,800 | $8,800 | $48,000 |
| 2022 | $667 | $52,120 | $8,800 | $43,320 |
| 2021 | $696 | $43,040 | $4,800 | $38,240 |
| 2020 | $594 | $22,160 | $2,400 | $19,760 |
| 2019 | $607 | $22,160 | $2,400 | $19,760 |
| 2018 | $586 | $22,160 | $2,400 | $19,760 |
| 2017 | $605 | $24,570 | $4,800 | $19,770 |
| 2016 | $620 | $25,310 | $4,800 | $20,510 |
| 2015 | $595 | $25,310 | $4,800 | $20,510 |
| 2014 | $595 | $24,657 | $4,800 | $19,857 |
Source: Public Records
Map
Nearby Homes
- 1241 Old Siloam Rd
- 1180 Moody St
- 1041 Hillcrest Dr
- 0 S Rhodes St Unit 10618488
- 202 Veazey St
- 606 Bryan Ave
- 504 Crawfordville Rd
- 324 N Rhodes St
- 0 Washington Hwy Unit 7276060
- 1251 Brick House Rd
- 1251 Brickhouse Rd
- 0 Cato Rd Unit 10525284
- 0 Woodland Ct Unit 1027434
- 0 Woodland Ct Unit 10543600
- 0 Buffalo Lick Rd Unit 10551328
- 1201 Buffalo Lick Rd
- 0 Buffalo Lick Rd Unit 10551325
- 0 Buffalo Lick Rd Unit 10551234
- 0 Old Union Point Rd Unit 1 10557753
- 1010 Orear Rd
- 1161 Green Acres Dr
- 1191 Green Acres Dr
- 1191 Green Acres Dr
- 1151 Green Acres Dr
- 1201 Green Acres Dr
- 1180 Green Acres Dr
- 1190 Green Acres Dr
- 1220 Green Acres Dr
- 1160 Green Acres Dr
- 1141 Green Acres Dr
- 1290 Green Acres Dr
- 1110 Green Acres Dr
- 1221 Green Acres Dr
- 1090 Green Acres Dr
- 1311 Green Acres Dr
- 1131 Green Acres Dr
- 131 Green Acres Dr
- 1231 Green Acres Dr
- 1010 Green Acres Way
- 1241 Green Acres Dr