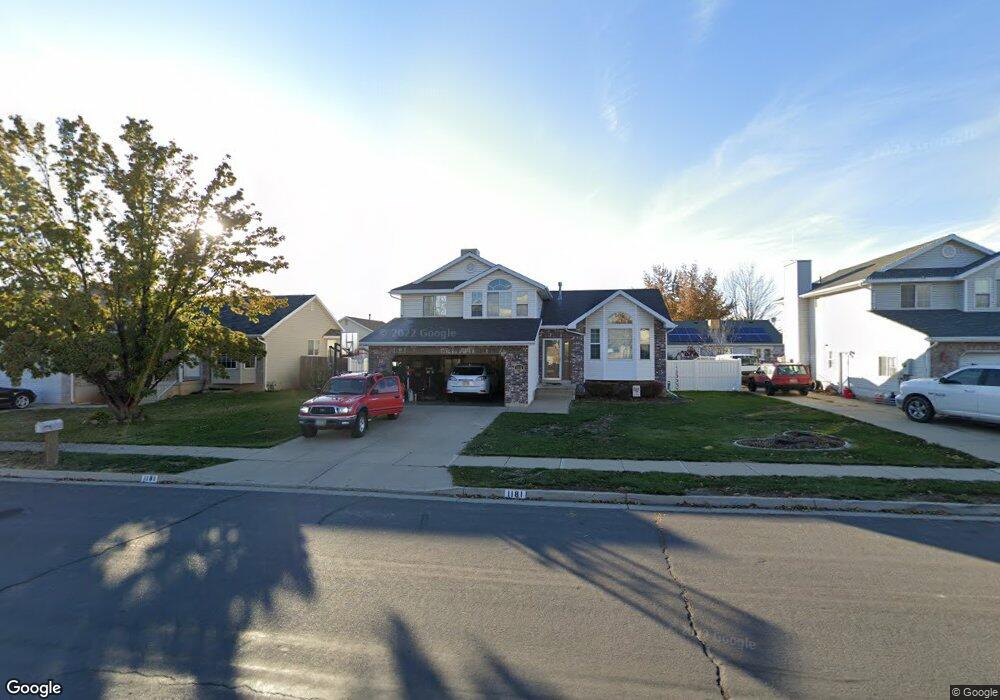
1181 N 2875 W Layton, UT 84041
Estimated Value: $495,635 - $516,000
5
Beds
3
Baths
1,714
Sq Ft
$295/Sq Ft
Est. Value
About This Home
This home is located at 1181 N 2875 W, Layton, UT 84041 and is currently estimated at $505,159, approximately $294 per square foot. 1181 N 2875 W is a home located in Davis County with nearby schools including Legacy Junior High School, Layton High School, and North Davis Preparatory Academy.
Ownership History
Date
Name
Owned For
Owner Type
Purchase Details
Closed on
Oct 18, 2013
Sold by
Cartus Financial Corp
Bought by
Sanganeria Mahesh K and Gaur Anju
Current Estimated Value
Purchase Details
Closed on
Aug 24, 2013
Sold by
Walker Daniel R
Bought by
Cartus Financial Corp
Purchase Details
Closed on
Jul 28, 2006
Sold by
Sirva Relocation Llc
Bought by
Walker Daniel R
Home Financials for this Owner
Home Financials are based on the most recent Mortgage that was taken out on this home.
Original Mortgage
$182,400
Interest Rate
5.62%
Mortgage Type
Purchase Money Mortgage
Purchase Details
Closed on
Jul 18, 2006
Sold by
Shelton Lee J and Shelton Marjorie L
Bought by
Sirva Relocation Llc
Home Financials for this Owner
Home Financials are based on the most recent Mortgage that was taken out on this home.
Original Mortgage
$182,400
Interest Rate
5.62%
Mortgage Type
Purchase Money Mortgage
Create a Home Valuation Report for This Property
The Home Valuation Report is an in-depth analysis detailing your home's value as well as a comparison with similar homes in the area
Home Values in the Area
Average Home Value in this Area
Purchase History
| Date | Buyer | Sale Price | Title Company |
|---|---|---|---|
| Sanganeria Mahesh K | -- | Metro National Title | |
| Cartus Financial Corp | -- | Metro National Title | |
| Walker Daniel R | -- | Bonneville Superior Title Co | |
| Sirva Relocation Llc | -- | Bonneville Superior Title Co |
Source: Public Records
Mortgage History
| Date | Status | Borrower | Loan Amount |
|---|---|---|---|
| Previous Owner | Walker Daniel R | $182,400 | |
| Previous Owner | Sirva Relocation Llc | $182,400 |
Source: Public Records
Tax History Compared to Growth
Tax History
| Year | Tax Paid | Tax Assessment Tax Assessment Total Assessment is a certain percentage of the fair market value that is determined by local assessors to be the total taxable value of land and additions on the property. | Land | Improvement |
|---|---|---|---|---|
| 2025 | $2,442 | $256,300 | $100,796 | $155,504 |
| 2024 | $2,356 | $249,149 | $113,517 | $135,632 |
| 2023 | $2,237 | $229,350 | $59,578 | $169,771 |
| 2022 | $2,445 | $450,000 | $128,086 | $321,914 |
| 2021 | $2,219 | $335,000 | $105,717 | $229,283 |
| 2020 | $2,003 | $290,000 | $88,159 | $201,841 |
| 2019 | $1,939 | $275,000 | $92,598 | $182,402 |
| 2018 | $1,763 | $251,000 | $80,974 | $170,026 |
| 2016 | $1,647 | $121,000 | $30,732 | $90,268 |
| 2015 | $1,561 | $108,845 | $30,732 | $78,113 |
| 2014 | $1,435 | $102,300 | $30,732 | $71,568 |
| 2013 | -- | $103,958 | $28,952 | $75,006 |
Source: Public Records
Map
Nearby Homes