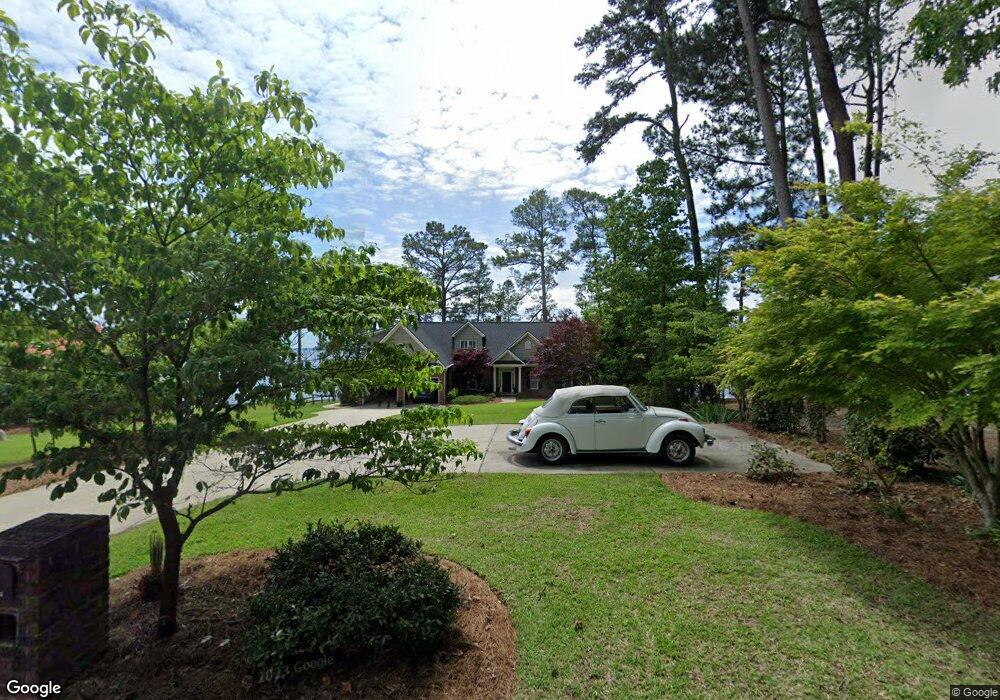
1181 Point View Rd Chapin, SC 29036
Estimated Value: $557,000 - $935,132
4
Beds
4
Baths
2,522
Sq Ft
$308/Sq Ft
Est. Value
About This Home
This home is located at 1181 Point View Rd, Chapin, SC 29036 and is currently estimated at $776,783, approximately $308 per square foot. 1181 Point View Rd is a home with nearby schools including Lake Murray Elementary School, Chapin Intermediate, and Chapin High School.
Ownership History
Date
Name
Owned For
Owner Type
Purchase Details
Closed on
Sep 28, 2016
Sold by
Lawrence Charles Edward and Lawrence Donna P
Bought by
Lawrence Charles Edward and Lawrence Donna W
Current Estimated Value
Purchase Details
Closed on
Jun 16, 2005
Sold by
Lawrence Charles Edward
Bought by
Lawrence Donna P
Home Financials for this Owner
Home Financials are based on the most recent Mortgage that was taken out on this home.
Original Mortgage
$250,000
Outstanding Balance
$129,674
Interest Rate
5.66%
Mortgage Type
New Conventional
Estimated Equity
$647,109
Purchase Details
Closed on
Aug 9, 2004
Sold by
Lawrence Joe M
Bought by
Lawrence Charles Edward
Create a Home Valuation Report for This Property
The Home Valuation Report is an in-depth analysis detailing your home's value as well as a comparison with similar homes in the area
Home Values in the Area
Average Home Value in this Area
Purchase History
| Date | Buyer | Sale Price | Title Company |
|---|---|---|---|
| Lawrence Charles Edward | -- | None Available | |
| Lawrence Donna P | -- | -- | |
| Lawrence Charles Edward | -- | -- |
Source: Public Records
Mortgage History
| Date | Status | Borrower | Loan Amount |
|---|---|---|---|
| Open | Lawrence Donna P | $250,000 |
Source: Public Records
Tax History Compared to Growth
Tax History
| Year | Tax Paid | Tax Assessment Tax Assessment Total Assessment is a certain percentage of the fair market value that is determined by local assessors to be the total taxable value of land and additions on the property. | Land | Improvement |
|---|---|---|---|---|
| 2024 | $3,239 | $21,906 | $12,449 | $9,457 |
| 2023 | $2,961 | $21,906 | $12,449 | $9,457 |
| 2022 | $3,001 | $21,906 | $12,449 | $9,457 |
| 2020 | $3,148 | $21,906 | $12,449 | $9,457 |
| 2019 | $2,733 | $19,049 | $8,960 | $10,089 |
| 2018 | $2,400 | $19,049 | $8,960 | $10,089 |
| 2017 | $2,334 | $19,049 | $8,960 | $10,089 |
| 2016 | $2,400 | $19,049 | $8,960 | $10,089 |
| 2014 | $2,154 | $17,375 | $9,200 | $8,175 |
| 2013 | -- | $17,380 | $9,200 | $8,180 |
Source: Public Records
Map
Nearby Homes
- 1118 Marble Arch Ct
- 1081 Point View Rd
- 143 Doolittle Dr
- 533 Mitscher Way
- 516 Mitscher Way
- 940 Willow Cove Rd
- 454 Brookridge Dr
- 450 Brookridge Dr Unit LOT 55
- 603 Riverdale Ct
- 640 Mallard Dr
- 2347 Hadley Crossing
- 2124 Ludlow Place
- 2130 Ludlow Place
- 2351 Hadley Crossing
- 3031 Chilmark Rd
- 2348 Hadley Crossing
- 2344 Hadley Crossing
- 135 Westridge Ct
- 3010 Chilmark Rd
- 154 Pebblebranch Dr
- 1195 Point View Rd
- 1179 Point View Rd
- 1184 Point View Rd
- 1169 Point View Rd
- 1199 Point View Rd
- 1198 Point View Rd
- 1180 Point View Rd
- 1164 Point View Rd
- 1161 Point View Rd
- 1160 Point View Rd
- 1151 Point View Rd
- 1156 Point View Rd
- 1148 Point View Rd
- 1140 Point View Rd
- 1205 Point View Ct
- 1134 Point View Rd
- 1133 Point View Rd
- 1111 Marble Arch Ct
- 1116 Marble Arch Ct
- 1125 Point View Rd