1181 Post Rd Warwick, RI 02888
Norwood NeighborhoodEstimated Value: $456,866
Studio
--
Bath
1,148
Sq Ft
$398/Sq Ft
Est. Value
About This Home
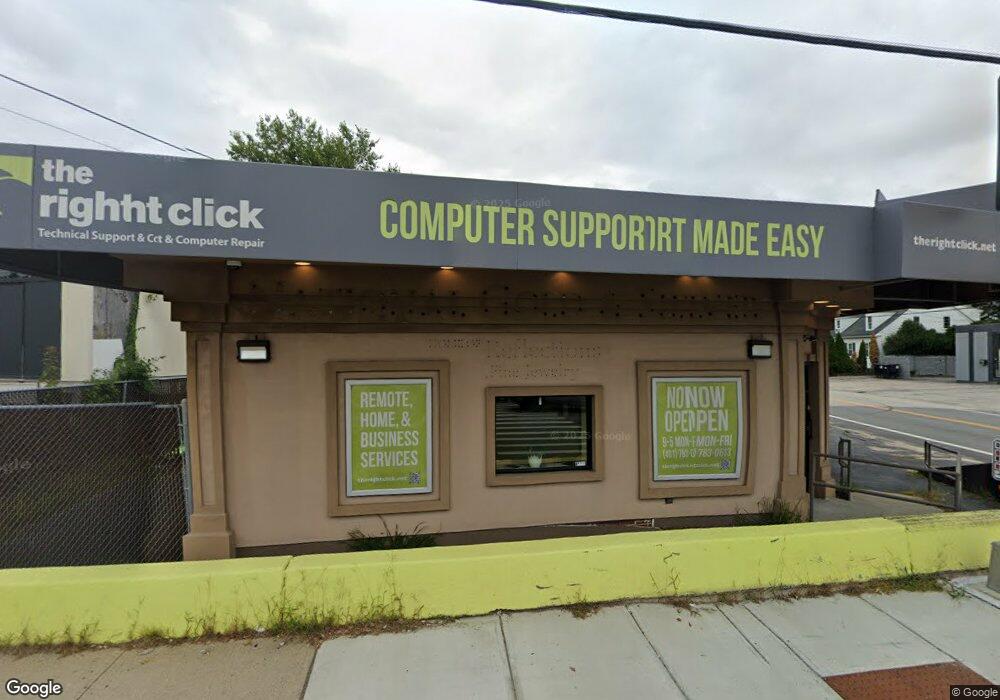
This home is located at 1181 Post Rd, Warwick, RI 02888 and is currently estimated at $456,866, approximately $397 per square foot. 1181 Post Rd is a home located in Kent County with nearby schools including Saint Kevin School.
Ownership History
Date
Name
Owned For
Owner Type
Purchase Details
Closed on
Aug 5, 2022
Sold by
Seyboth Kyle F
Bought by
Mojo Properties Llc
Current Estimated Value
Home Financials for this Owner
Home Financials are based on the most recent Mortgage that was taken out on this home.
Original Mortgage
$197,350
Outstanding Balance
$187,887
Interest Rate
5.81%
Mortgage Type
Purchase Money Mortgage
Estimated Equity
$268,979
Purchase Details
Closed on
Jul 31, 2019
Sold by
Cipolla Steven A
Bought by
Seyboth Keyle F
Purchase Details
Closed on
Feb 3, 2012
Sold by
Reo Thomas
Bought by
Cipolla Steven
Purchase Details
Closed on
Jul 21, 1995
Sold by
Culton Richard A and Culton Betty
Bought by
Reo Thomas and Reo Sandra
Home Financials for this Owner
Home Financials are based on the most recent Mortgage that was taken out on this home.
Original Mortgage
$121,500
Interest Rate
7.49%
Mortgage Type
Commercial
Create a Home Valuation Report for This Property
The Home Valuation Report is an in-depth analysis detailing your home's value as well as a comparison with similar homes in the area
Home Values in the Area
Average Home Value in this Area
Purchase History
| Date | Buyer | Sale Price | Title Company |
|---|---|---|---|
| Mojo Properties Llc | $360,000 | None Available | |
| Mojo Properties Llc | $360,000 | None Available | |
| Seyboth Keyle F | $287,500 | -- | |
| Seyboth Keyle F | $287,500 | -- | |
| Cipolla Steven | $80,000 | -- | |
| Cipolla Steven | $80,000 | -- | |
| Reo Thomas | $135,000 | -- | |
| Reo Thomas | $135,000 | -- |
Source: Public Records
Mortgage History
| Date | Status | Borrower | Loan Amount |
|---|---|---|---|
| Open | Mojo Properties Llc | $197,350 | |
| Closed | Mojo Properties Llc | $197,350 | |
| Previous Owner | Reo Thomas | $121,500 |
Source: Public Records
Tax History
| Year | Tax Paid | Tax Assessment Tax Assessment Total Assessment is a certain percentage of the fair market value that is determined by local assessors to be the total taxable value of land and additions on the property. | Land | Improvement |
|---|---|---|---|---|
| 2025 | $6,710 | $279,700 | $79,300 | $200,400 |
| 2024 | $6,684 | $264,000 | $68,800 | $195,200 |
| 2023 | $6,555 | $264,000 | $68,800 | $195,200 |
| 2022 | $3,850 | $137,000 | $54,600 | $82,400 |
| 2021 | $3,850 | $137,000 | $54,600 | $82,400 |
| 2020 | $3,850 | $137,000 | $54,600 | $82,400 |
| 2019 | $3,850 | $137,000 | $54,600 | $82,400 |
| 2018 | $4,023 | $132,500 | $68,200 | $64,300 |
| 2017 | $4,023 | $132,500 | $68,200 | $64,300 |
| 2016 | $4,023 | $132,500 | $68,200 | $64,300 |
| 2015 | $3,860 | $124,000 | $78,300 | $45,700 |
| 2014 | $3,731 | $124,000 | $78,300 | $45,700 |
| 2013 | $3,680 | $124,000 | $78,300 | $45,700 |
Source: Public Records
Map
Nearby Homes
- 175 Pettaconsett Ave
- 1052 Post Rd
- 27 Frederick St
- 22 Phillips Ave
- 35 Welfare Ave
- 213 Easton Ave
- 821 Post Rd
- 80 George St
- 123 Harrington Ave
- 0 Elmwood Ave
- 39 Holiday Ave
- 90 Massachusetts Ave
- 15 Christopher Rhodes Way
- 6 Christopher Rhodes Way
- 77 Kentucky Ave
- 20 Commodore Ave
- 136 Sherwood Ave
- 120 Sherwood Ave
- 63 Benbridge Ave
- 127 Sherwood Ave
- 1191 Post Rd
- 399 Norwood Ave
- 1175 Post Rd Unit B
- 395 Norwood Ave
- 396 Norwood Ave
- 1184 Post Rd
- 391 Norwood Ave
- 1159 Post Rd
- 390 Norwood Ave
- 385 Norwood Ave
- 1153 Post Rd
- 386 Norwood Ave
- 271 Welfare Ave
- 272 Pettaconsett Ave
- 381 Norwood Ave
- 1204 Post Rd
- 1160 Post Rd
- 380 Norwood Ave
- 265 Welfare Ave
- 375 Norwood Ave
Your Personal Tour Guide
Ask me questions while you tour the home.