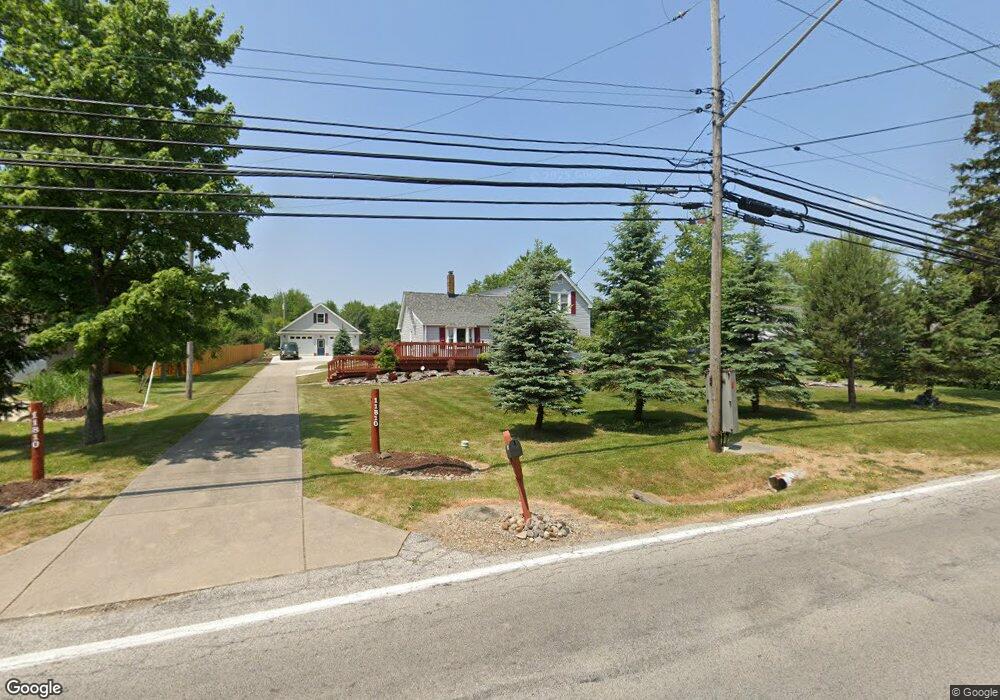
11810 Abbey Rd North Royalton, OH 44133
Estimated Value: $306,000 - $397,000
4
Beds
2
Baths
1,526
Sq Ft
$237/Sq Ft
Est. Value
About This Home
This home is located at 11810 Abbey Rd, North Royalton, OH 44133 and is currently estimated at $361,714, approximately $237 per square foot. 11810 Abbey Rd is a home located in Cuyahoga County with nearby schools including North Royalton Middle School, North Royalton High School, and Royal Redeemer Lutheran School.
Ownership History
Date
Name
Owned For
Owner Type
Purchase Details
Closed on
Sep 23, 1998
Sold by
Deoras Satish B and Jain Subodh K
Bought by
Casapis Dean M
Current Estimated Value
Home Financials for this Owner
Home Financials are based on the most recent Mortgage that was taken out on this home.
Original Mortgage
$140,000
Outstanding Balance
$30,140
Interest Rate
6.99%
Estimated Equity
$331,574
Purchase Details
Closed on
Sep 21, 1995
Sold by
Komorowski Joseph
Bought by
Casapis Dean M and Casapis Satish B
Home Financials for this Owner
Home Financials are based on the most recent Mortgage that was taken out on this home.
Original Mortgage
$120,000
Interest Rate
7.78%
Mortgage Type
New Conventional
Purchase Details
Closed on
Nov 4, 1976
Sold by
Salaciak Frank
Bought by
Komorowski Ann
Purchase Details
Closed on
Jul 15, 1975
Sold by
Salaciak Frank and Salaciak Antonina
Bought by
Salaciak Frank
Purchase Details
Closed on
Jan 1, 1975
Bought by
Salaciak Frank and Salaciak Antonina
Create a Home Valuation Report for This Property
The Home Valuation Report is an in-depth analysis detailing your home's value as well as a comparison with similar homes in the area
Home Values in the Area
Average Home Value in this Area
Purchase History
| Date | Buyer | Sale Price | Title Company |
|---|---|---|---|
| Casapis Dean M | $128,200 | -- | |
| Casapis Dean M | $177,100 | -- | |
| Komorowski Ann | $56,000 | -- | |
| Salaciak Frank | -- | -- | |
| Salaciak Frank | -- | -- |
Source: Public Records
Mortgage History
| Date | Status | Borrower | Loan Amount |
|---|---|---|---|
| Open | Casapis Dean M | $140,000 | |
| Previous Owner | Casapis Dean M | $120,000 |
Source: Public Records
Tax History Compared to Growth
Tax History
| Year | Tax Paid | Tax Assessment Tax Assessment Total Assessment is a certain percentage of the fair market value that is determined by local assessors to be the total taxable value of land and additions on the property. | Land | Improvement |
|---|---|---|---|---|
| 2024 | $4,280 | $72,100 | $26,670 | $45,430 |
| 2023 | $3,299 | $51,000 | $16,590 | $34,410 |
| 2022 | $3,088 | $48,060 | $16,590 | $31,470 |
| 2021 | $3,124 | $48,060 | $16,590 | $31,470 |
| 2020 | $2,834 | $41,440 | $14,320 | $27,130 |
| 2019 | $2,753 | $118,400 | $40,900 | $77,500 |
| 2018 | $1,393 | $41,440 | $14,320 | $27,130 |
| 2017 | $2,391 | $33,990 | $14,320 | $19,670 |
| 2016 | $2,245 | $33,990 | $14,320 | $19,670 |
| 2015 | $2,263 | $33,990 | $14,320 | $19,670 |
| 2014 | $2,263 | $33,990 | $14,320 | $19,670 |
Source: Public Records
Map
Nearby Homes
- 11806 Harbour Light Dr Unit 1806
- 11650 Harbour Light Dr Unit 1650
- 10700 Abbey Rd
- 11445 Harbour Light Dr
- 10560 Independence Dr Unit 25A
- 9821 Sunrise Blvd Unit o1
- 12664 W 130th St
- 10364 Independence Dr Unit 19c
- 9761 Sunrise Blvd
- 9800 Cove Dr Unit H2
- 10342 Independence Dr Unit 21B
- 9938 Abbey Rd
- 9710 Cove Dr Unit 23G
- 13402 Bridgecreek Cir
- 9660 Cove Dr Unit F13
- 9630 Cove Dr Unit A-14
- 9611 Sunrise Blvd Unit K2
- 10641 Albion Rd
- 9530 Cove Dr Unit C-25
- 9510 Cove Dr Unit C12
- 11822 Abbey Rd
- 11486 Abbey Rd
- VL Abbey Rd
- V/L 4 Abbey Rd
- V/L 3 Abbey Rd
- 11474 Abbey Rd
- 11789 Abbey Rd
- 11462 Abbey Rd
- 11912 Abbey Rd
- 11883 Abbey Rd
- 11841 Abbey Rd
- 11995 Harbour Light Dr Unit 1995
- 11999 Harbour Light Dr Unit 1999
- 11993 Harbour Light Dr Unit 1993
- 11997 Harbour Light Dr
- 11995 Harbour Light Dr Unit 1-1995
- 11917 Abbey Rd
- 11924 Abbey Rd
- 11595 Abbey Rd
- 11979 Harbour Light Dr