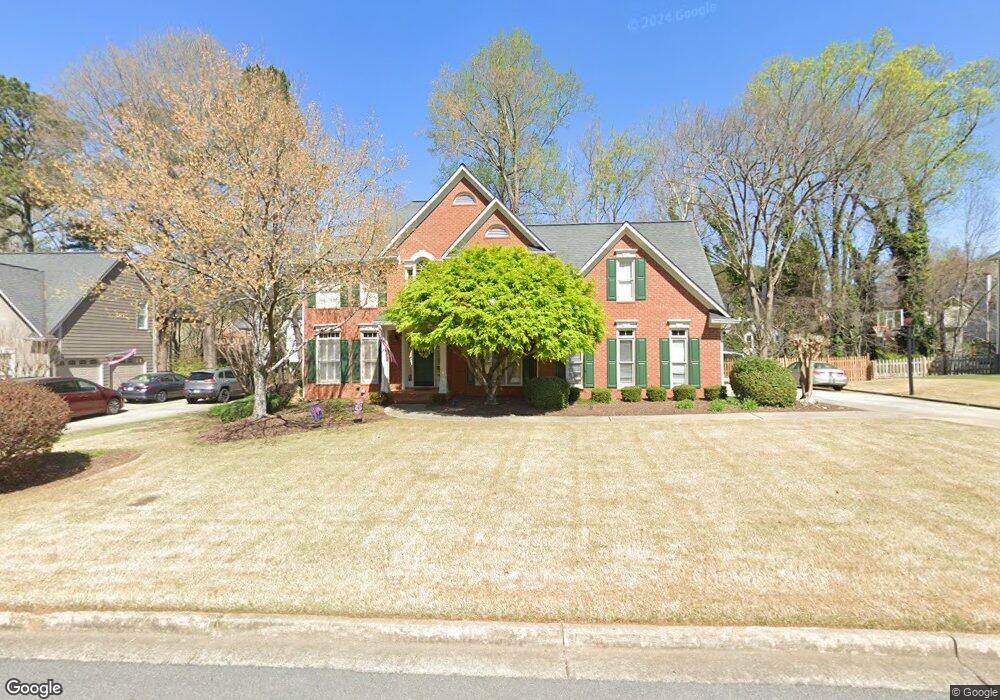
11810 Devon Downs Trail Alpharetta, GA 30005
Seven Oaks NeighborhoodEstimated Value: $708,000 - $823,000
4
Beds
3
Baths
2,846
Sq Ft
$263/Sq Ft
Est. Value
About This Home
This home is located at 11810 Devon Downs Trail, Alpharetta, GA 30005 and is currently estimated at $747,998, approximately $262 per square foot. 11810 Devon Downs Trail is a home located in Fulton County with nearby schools including Taylor Road Middle School, Chattahoochee High School, and Cresco Montessori School - Johns Creek Campus.
Ownership History
Date
Name
Owned For
Owner Type
Purchase Details
Closed on
Jun 25, 2010
Sold by
Anderson Jeffrey L and Anderson Lisa A
Bought by
Vanstone Sarah L and Vanstone Michael D
Current Estimated Value
Home Financials for this Owner
Home Financials are based on the most recent Mortgage that was taken out on this home.
Original Mortgage
$240,000
Outstanding Balance
$160,358
Interest Rate
4.83%
Mortgage Type
New Conventional
Estimated Equity
$587,640
Purchase Details
Closed on
Feb 26, 1998
Sold by
Rudd David D and Rudd Sandra
Bought by
Evans Robt G and Evans Kristin
Home Financials for this Owner
Home Financials are based on the most recent Mortgage that was taken out on this home.
Original Mortgage
$212,400
Interest Rate
6.95%
Mortgage Type
New Conventional
Purchase Details
Closed on
Apr 14, 1994
Sold by
Wieland John Homes Inc
Bought by
Rudd David D Sandra S
Home Financials for this Owner
Home Financials are based on the most recent Mortgage that was taken out on this home.
Original Mortgage
$203,150
Interest Rate
6.12%
Create a Home Valuation Report for This Property
The Home Valuation Report is an in-depth analysis detailing your home's value as well as a comparison with similar homes in the area
Home Values in the Area
Average Home Value in this Area
Purchase History
| Date | Buyer | Sale Price | Title Company |
|---|---|---|---|
| Vanstone Sarah L | $390,000 | -- | |
| Evans Robt G | $265,900 | -- | |
| Rudd David D Sandra S | $233,100 | -- |
Source: Public Records
Mortgage History
| Date | Status | Borrower | Loan Amount |
|---|---|---|---|
| Open | Vanstone Sarah L | $240,000 | |
| Previous Owner | Evans Robt G | $212,400 | |
| Previous Owner | Rudd David D Sandra S | $203,150 |
Source: Public Records
Tax History
| Year | Tax Paid | Tax Assessment Tax Assessment Total Assessment is a certain percentage of the fair market value that is determined by local assessors to be the total taxable value of land and additions on the property. | Land | Improvement |
|---|---|---|---|---|
| 2025 | $4,452 | $320,400 | $71,320 | $249,080 |
| 2023 | $7,781 | $275,680 | $72,200 | $203,480 |
| 2022 | $4,259 | $220,800 | $36,200 | $184,600 |
| 2021 | $4,206 | $174,600 | $37,720 | $136,880 |
| 2020 | $4,237 | $171,880 | $31,640 | $140,240 |
| 2019 | $609 | $168,840 | $31,080 | $137,760 |
| 2018 | $4,971 | $164,880 | $30,360 | $134,520 |
| 2017 | $5,063 | $160,920 | $28,360 | $132,560 |
| 2016 | $4,822 | $160,920 | $28,360 | $132,560 |
| 2015 | $4,518 | $145,720 | $28,360 | $117,360 |
| 2014 | $3,649 | $116,520 | $22,680 | $93,840 |
Source: Public Records
Map
Nearby Homes
- 11735 Bentham Ct
- 11705 Bentham Ct Unit 1
- 12140 Helleri Hollow
- 230 Leaf Ct Unit 604
- 385 Cadeleigh Ct
- 775 Ellsborough Ct
- 5965 Barrington Ln
- 1010 Vinebrook Ln
- 12215 Winding Oak Trail
- 11840 Windbrooke Way
- 7260 Fawn Lake Dr
- 12313 Sunset Maple Terrace
- 11480 Bentham Ct Unit 2
- 820 Yearling Chase
- 130 Wyndlam Ct
- 7160 Fawn Lake Dr
- 5735 Sunset Maple Dr
- 700 Doe Ct
- 5325 Hillgate Crossing
- 200 Blue Spruce Cir
- 11820 Devon Downs Trail
- 11800 Devon Downs Trail Unit 1B
- 470 Millhaven Way
- 460 Millhaven Way
- 480 Millhaven Way
- 200 Devon Downs Place
- 450 Millhaven Way Unit 1A
- 11790 Devon Downs Trail
- 11830 Devon Downs Trail
- 490 490 Millhaven Way
- 490 Millhaven Way
- 11805 Devon Downs Trail
- 440 Millhaven Way Unit 1A
- 11840 Devon Downs Trail Unit 1A
- 445 Millhaven Way
- 455 Millhaven Way Unit 1A
- 11780 Devon Downs Trail
- 210 Devon Downs Place Unit 1B
- 465 Millhaven Way
- 495 Millhaven Way Unit 1A
Your Personal Tour Guide
Ask me questions while you tour the home.