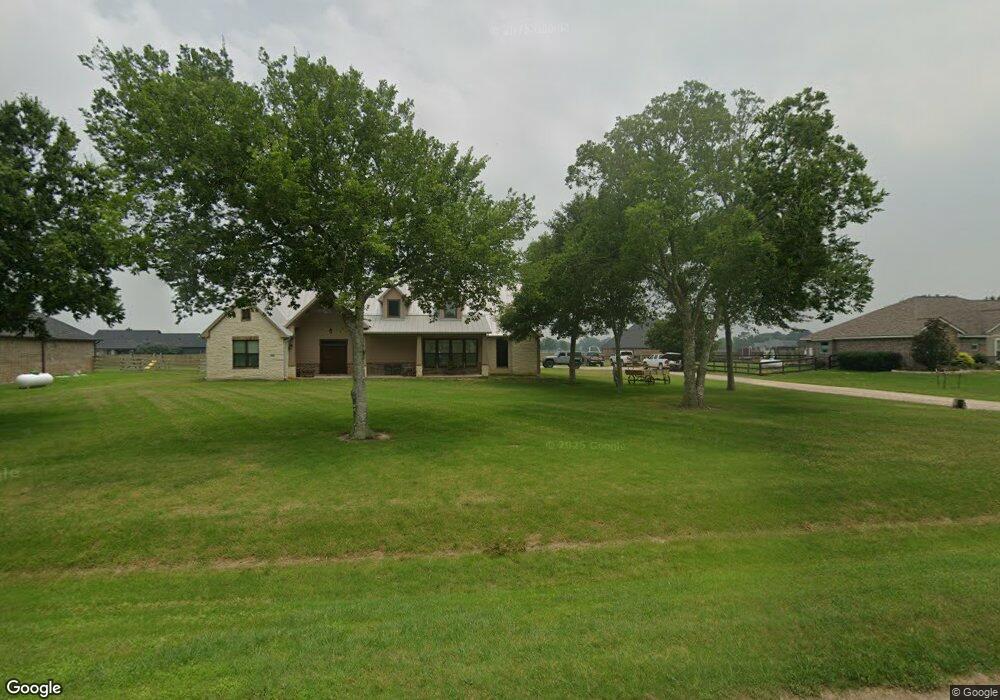
11811 Bisonte St Needville, TX 77461
Estimated Value: $475,000 - $688,000
3
Beds
3
Baths
2,802
Sq Ft
$207/Sq Ft
Est. Value
About This Home
This home is located at 11811 Bisonte St, Needville, TX 77461 and is currently estimated at $579,550, approximately $206 per square foot. 11811 Bisonte St is a home with nearby schools including Needville Elementary School, Needville Middle School, and Needville Junior High School.
Ownership History
Date
Name
Owned For
Owner Type
Purchase Details
Closed on
Sep 19, 2018
Sold by
Gaulke Interest Ii Llc
Bought by
Hackstedt Randall J and Hackstedt Jean S
Current Estimated Value
Home Financials for this Owner
Home Financials are based on the most recent Mortgage that was taken out on this home.
Original Mortgage
$195,000
Outstanding Balance
$169,701
Interest Rate
4.5%
Mortgage Type
Purchase Money Mortgage
Estimated Equity
$409,849
Purchase Details
Closed on
Dec 16, 2016
Sold by
Mccumber Caleb and Mccumber Casey
Bought by
Gaulke Interest Ii Llc
Purchase Details
Closed on
Oct 30, 2015
Sold by
Bercher Don
Bought by
Mccumber Caleb and Mccumber Casey
Purchase Details
Closed on
Dec 13, 2013
Sold by
Lone Star Bank
Bought by
Gaulke Interest Ii Llc
Create a Home Valuation Report for This Property
The Home Valuation Report is an in-depth analysis detailing your home's value as well as a comparison with similar homes in the area
Home Values in the Area
Average Home Value in this Area
Purchase History
| Date | Buyer | Sale Price | Title Company |
|---|---|---|---|
| Hackstedt Randall J | -- | Select Title Llc | |
| Gaulke Interest Ii Llc | -- | None Available | |
| Mccumber Caleb | -- | Startex Title Co Llc | |
| Gaulke Interest Ii Llc | -- | -- | |
| Gaulke Interest Ii Llc | -- | -- |
Source: Public Records
Mortgage History
| Date | Status | Borrower | Loan Amount |
|---|---|---|---|
| Open | Hackstedt Randall J | $195,000 |
Source: Public Records
Tax History Compared to Growth
Tax History
| Year | Tax Paid | Tax Assessment Tax Assessment Total Assessment is a certain percentage of the fair market value that is determined by local assessors to be the total taxable value of land and additions on the property. | Land | Improvement |
|---|---|---|---|---|
| 2025 | $6,129 | $557,474 | $125,161 | $432,313 |
| 2024 | $6,129 | $534,372 | $28,912 | $505,460 |
| 2023 | $5,885 | $485,793 | $0 | $516,363 |
| 2022 | $7,198 | $441,630 | $0 | $476,830 |
| 2021 | $7,611 | $401,480 | $55,970 | $345,510 |
| 2020 | $7,745 | $383,130 | $55,970 | $327,160 |
| 2019 | $7,913 | $368,580 | $57,720 | $310,860 |
| 2018 | $4,311 | $201,020 | $39,970 | $161,050 |
| 2017 | $769 | $35,730 | $35,730 | $0 |
| 2016 | $572 | $26,570 | $26,570 | $0 |
| 2015 | $531 | $24,270 | $24,270 | $0 |
| 2014 | $278 | $12,500 | $12,500 | $0 |
Source: Public Records
Map
Nearby Homes
- 11810 Bisonte St
- 11834 Bisonte St
- 11702 Bisonte St
- 11802 Padon Rd
- 11814 Roesler Rd
- 10853 Padon Rd
- 12239 Padon Rd
- 11310 Audrey Dr
- 11102 Aaron Way
- 11203 Leah Elizabeth Dr
- 0 Jeske Rd Unit 44835741
- 10507 Padon Rd
- 11802 Joyce Ln
- 11019 Water Tower Dr
- 14935 Highway 36
- 10335 Filly Dr
- 10202 Harry Dr
- 12009 Dannhaus Rd
- 12710 Dannhaus Rd
- 13816 School St
- 11803 Bisonte St
- 11819 Bisonte St
- 0 Casadores Blvd Unit 74782440
- 0 Casadores Blvd Unit 68205304
- 0 Casadores Blvd Unit 51596604
- 0 Casadores Blvd Unit 35656463
- 0 Casadores Blvd Unit 61057471
- 0 Casadores Blvd Unit 95297444
- 11810 Casadores Blvd
- 11802 Bisonte St
- 11818 Casadores Blvd
- 11818 Casadores Blvd
- 11605 Venado St
- 11802 Casadores Blvd
- 11826 Bisonte St
- 11726 Bisonte St
- 11826 Casadores Blvd
- Padon SE Casadores Blvd NE
- 11718 Casadores Ln
- 0 Bisonte St