Estimated Value: $255,915 - $276,000
2
Beds
3
Baths
1,200
Sq Ft
$223/Sq Ft
Est. Value
About This Home
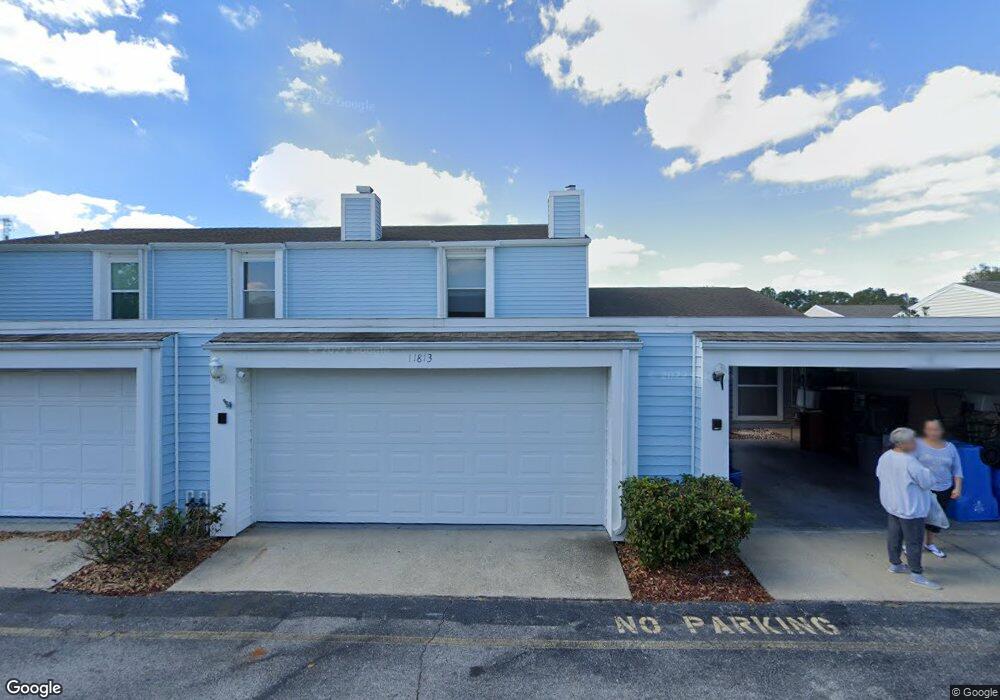
This home is located at 11813 Cypress Crest Cir, Tampa, FL 33626 and is currently estimated at $267,979, approximately $223 per square foot. 11813 Cypress Crest Cir is a home located in Hillsborough County with nearby schools including Deer Park Elementary School, Davidsen Middle School, and Sickles High School.
Ownership History
Date
Name
Owned For
Owner Type
Purchase Details
Closed on
Mar 20, 2020
Sold by
Bertrand Sheldon Mark and Bertrand Cheryl
Bought by
Chilldon Anne Elizabeth
Current Estimated Value
Home Financials for this Owner
Home Financials are based on the most recent Mortgage that was taken out on this home.
Original Mortgage
$152,475
Outstanding Balance
$134,781
Interest Rate
3.4%
Mortgage Type
New Conventional
Estimated Equity
$133,198
Purchase Details
Closed on
May 6, 2016
Sold by
Bletsch Gerald and Bletsch Gerald N
Bought by
Bertrand Sheldon Mark and Bertrand Cherly
Purchase Details
Closed on
Jan 24, 2014
Sold by
Beltsch Gerald
Bought by
Perna Mat and Bletsch Gerald
Purchase Details
Closed on
Feb 22, 2013
Sold by
Newton Woodham Donald Wayne
Bought by
Wooham Larry Newton and Woodham David Earl
Purchase Details
Closed on
Feb 20, 2013
Sold by
Woodham Donald Wayne and Woodham David Earl
Bought by
Bletsch Gerald N
Create a Home Valuation Report for This Property
The Home Valuation Report is an in-depth analysis detailing your home's value as well as a comparison with similar homes in the area
Home Values in the Area
Average Home Value in this Area
Purchase History
| Date | Buyer | Sale Price | Title Company |
|---|---|---|---|
| Chilldon Anne Elizabeth | $160,500 | Total Title Solutions Llc | |
| Bertrand Sheldon Mark | $99,000 | Westchase Title Llc | |
| Perna Mat | -- | None Available | |
| Wooham Larry Newton | -- | Attorney | |
| Bletsch Gerald N | $50,000 | North American Title Company |
Source: Public Records
Mortgage History
| Date | Status | Borrower | Loan Amount |
|---|---|---|---|
| Open | Chilldon Anne Elizabeth | $152,475 |
Source: Public Records
Tax History Compared to Growth
Tax History
| Year | Tax Paid | Tax Assessment Tax Assessment Total Assessment is a certain percentage of the fair market value that is determined by local assessors to be the total taxable value of land and additions on the property. | Land | Improvement |
|---|---|---|---|---|
| 2024 | $2,291 | $148,866 | -- | -- |
| 2023 | $2,191 | $144,530 | $0 | $0 |
| 2022 | $2,056 | $140,320 | $0 | $0 |
| 2021 | $2,026 | $136,233 | $100 | $136,133 |
| 2020 | $2,407 | $129,691 | $100 | $129,591 |
| 2019 | $2,163 | $118,487 | $100 | $118,387 |
| 2018 | $2,029 | $110,460 | $0 | $0 |
| 2017 | $1,774 | $84,337 | $0 | $0 |
| 2016 | $762 | $64,090 | $0 | $0 |
| 2015 | $773 | $63,644 | $0 | $0 |
| 2014 | $1,352 | $59,900 | $0 | $0 |
| 2013 | -- | $60,549 | $0 | $0 |
Source: Public Records
Map
Nearby Homes
- 11913 Congressional Dr Unit 11913
- 11907 Dietz Dr
- 9110 Sheldon Dr W
- 11638 Sweet Tangerine Ln
- 11613 Sweet Tangerine Ln
- 9834 Lake Chase Island Way Unit 9834
- 9028 Lake Chase Island Way
- 9042 Lake Chase Island Way
- 8840 Cameron Crest Dr
- 8836 Cameron Crest Dr
- 9064 Lake Chase Island Way
- 9730 Lake Chase Island Way Unit 9730
- 9740 Lake Chase Island Way
- 10520 White Lake Ct Unit 10520
- 12326 Terracina Chase Ct
- 9088 Lake Chase Island Way
- 10412 White Lake Ct Unit 10406
- 10430 White Lake Ct Unit 10430
- 9650 Lake Chase Island Way
- 8805 Casablanca Way
- 11813 Cypress Crest Cir Unit 11813
- 11815 Cypress Crest Cir
- 11811 Cypress Crest Cir Unit 11811
- 11817 Cypress Crest Cir
- 11809 Cypress Crest Cir Unit 18
- 11905 Cypress Crest Cir
- 11907 Cypress Crest Cir
- 11903 Cypress Crest Cir
- 11807 Cypress Crest Cir Unit 19
- 11901 Cypress Crest Cir Unit 31
- 11909 Cypress Crest Cir Unit 27
- 11805 Cypress Crest Cir Unit 11805
- 11805 Cypress Crest Cir
- 11911 Cypress Crest Cir
- 11814 Cypress Crest Cir
- 11803 Cypress Crest Cir Unit 21
- 11816 Cypress Crest Cir
- 11818 Cypress Crest Cir Unit 9
- 11820 Cypress Crest Cir
- 11822 Cypress Crest Cir