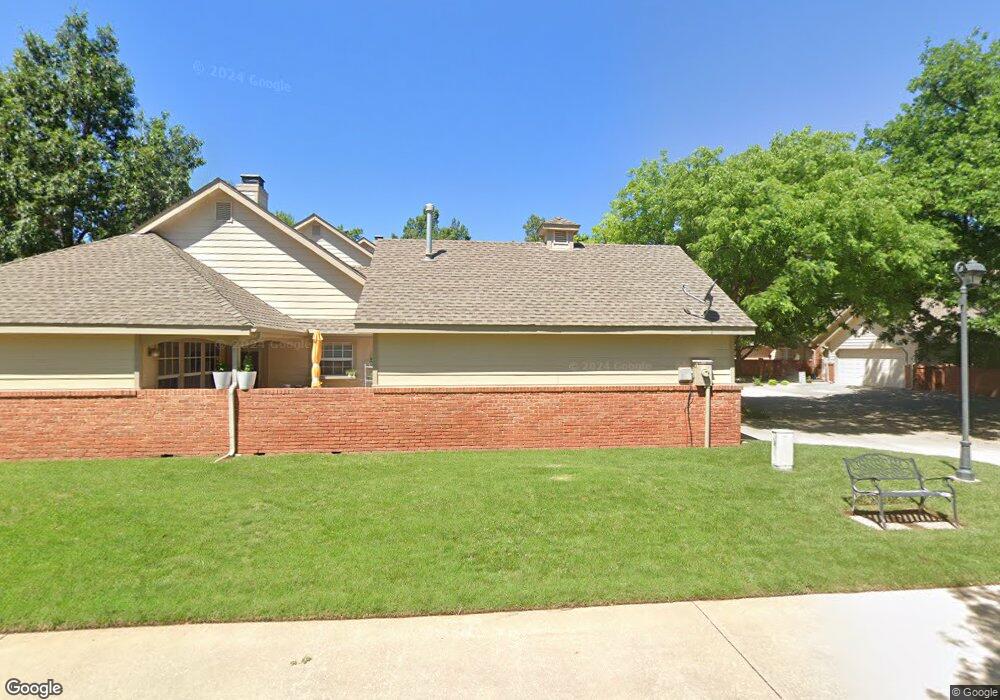
11815 Red Oak Way Unit IIC Oklahoma City, OK 73162
Warwick NeighborhoodEstimated Value: $184,248 - $227,000
2
Beds
2
Baths
1,268
Sq Ft
$162/Sq Ft
Est. Value
About This Home
This home is located at 11815 Red Oak Way Unit IIC, Oklahoma City, OK 73162 and is currently estimated at $205,312, approximately $161 per square foot. 11815 Red Oak Way Unit IIC is a home located in Oklahoma County with nearby schools including Dennis Elementary School, Hefner Middle School, and Putnam City North High School.
Ownership History
Date
Name
Owned For
Owner Type
Purchase Details
Closed on
Feb 13, 2012
Sold by
Martin Paul J and Martin Patsy F
Bought by
The Paul & Patsy Martin Family Revocable
Current Estimated Value
Purchase Details
Closed on
Apr 22, 2011
Sold by
Prather Scott and Prather Tami Rae
Bought by
Martin Paul J and Martin Patsy F
Purchase Details
Closed on
Aug 12, 2008
Sold by
Davis Randolph Dale and Davis Marilyn
Bought by
Prather S Scott
Home Financials for this Owner
Home Financials are based on the most recent Mortgage that was taken out on this home.
Original Mortgage
$85,000
Interest Rate
6.29%
Mortgage Type
Purchase Money Mortgage
Purchase Details
Closed on
Aug 7, 2001
Sold by
Davis Sally A
Bought by
Davis Sally A and Davis Randolph Dale
Create a Home Valuation Report for This Property
The Home Valuation Report is an in-depth analysis detailing your home's value as well as a comparison with similar homes in the area
Home Values in the Area
Average Home Value in this Area
Purchase History
| Date | Buyer | Sale Price | Title Company |
|---|---|---|---|
| The Paul & Patsy Martin Family Revocable | -- | Capitol Abstract & Title Co | |
| Martin Paul J | $131,500 | Capitol Abstract & Title Co | |
| Prather S Scott | $125,000 | Capitol Abstract & Title Co | |
| Davis Sally A | -- | American Guaranty Title Co |
Source: Public Records
Mortgage History
| Date | Status | Borrower | Loan Amount |
|---|---|---|---|
| Previous Owner | Prather S Scott | $85,000 |
Source: Public Records
Tax History Compared to Growth
Tax History
| Year | Tax Paid | Tax Assessment Tax Assessment Total Assessment is a certain percentage of the fair market value that is determined by local assessors to be the total taxable value of land and additions on the property. | Land | Improvement |
|---|---|---|---|---|
| 2024 | $1,902 | $16,377 | $2,004 | $14,373 |
| 2023 | $1,902 | $15,598 | $1,992 | $13,606 |
| 2022 | $1,833 | $14,855 | $2,341 | $12,514 |
| 2021 | $1,729 | $14,148 | $1,608 | $12,540 |
| 2020 | $1,640 | $13,475 | $1,650 | $11,825 |
| 2019 | $1,576 | $13,145 | $1,650 | $11,495 |
| 2018 | $1,538 | $12,815 | $0 | $0 |
| 2017 | $1,481 | $12,320 | $1,782 | $10,538 |
| 2016 | $1,453 | $12,102 | $1,782 | $10,320 |
| 2015 | $1,454 | $11,968 | $1,782 | $10,186 |
| 2014 | $1,690 | $14,460 | $1,782 | $12,678 |
Source: Public Records
Map
Nearby Homes
- 6112 Rambridge Dr
- 11717 Bellhurst Ave
- 11824 Bellhurst Ave
- 6108 Plum Thicket Rd
- 11917 Dornick Cir
- 6308 Westbrook Dr
- 11413 Spring Creek Rd
- 6116 Winfield Dr
- 11305 Cedar Hollow Rd
- 5613 NW 115th St
- 5601 NW 116th St
- 6348 Hyde Park Dr
- 11113 Blue Stem Dr
- 5513 NW 120th St
- 11201 Blue Stem Dr
- 5509 NW 120th St
- 12424 Fox Run Dr
- 5408 NW 119th Terrace
- 6400 Beaver Creek Rd
- 12512 Doons Dr
- 11813 Red Oak Way Unit 2B
- 11803 Red Oak Way
- 11807 Red Oak Way Unit 111C1
- 11807 Red Oak Way Unit III C-1
- 11805 Red Oak Way
- 11801 Red Oak Way
- 11806 Red Oak Way
- 11814 Red Oak Way Unit B
- 11808 Red Oak Way
- 11804 Red Oak Way
- 11800 Red Oak Way
- 11810 Red Oak Way Unit VA
- 11802 Red Oak Way
- 11812 Red Oak Way
- 11812 Red Oak Way Unit VD
- 11809 Red Oak Way
- 11816 Red Oak Way
- 11818 Red Oak Way
- 11820 Red Oak Way Unit VIB
- 11817 Red Oak Way Unit 1A