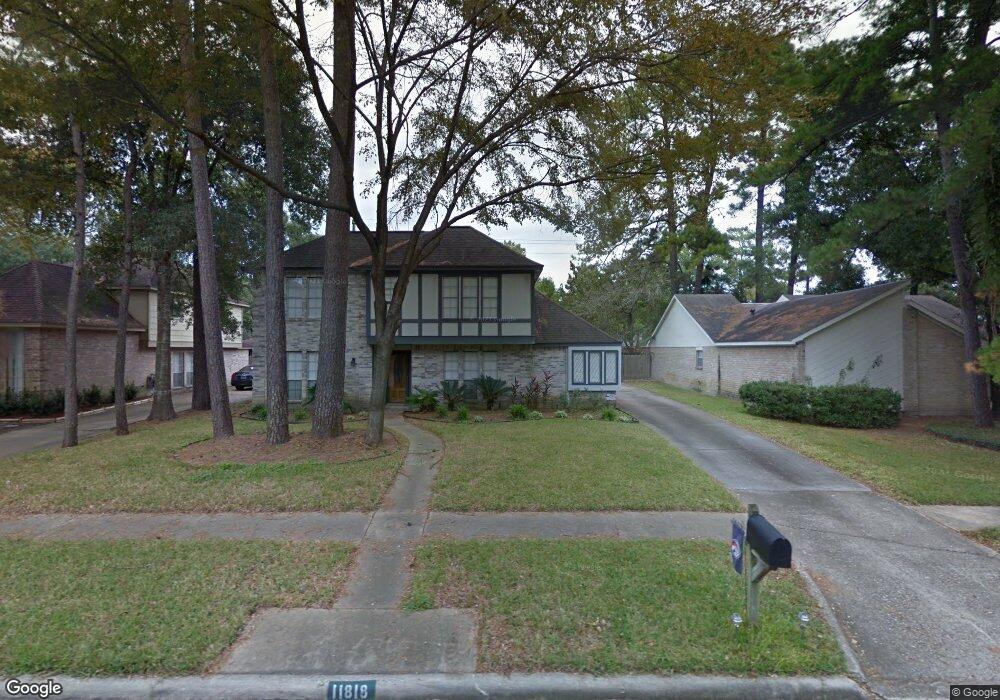
11818 Hillbrook Dr Houston, TX 77070
Estimated Value: $310,000 - $328,254
4
Beds
3
Baths
2,053
Sq Ft
$155/Sq Ft
Est. Value
About This Home
This home is located at 11818 Hillbrook Dr, Houston, TX 77070 and is currently estimated at $318,064, approximately $154 per square foot. 11818 Hillbrook Dr is a home located in Harris County with nearby schools including Lakewood Elementary School, Willow Wood Junior High School, and Northpointe Intermediate School.
Ownership History
Date
Name
Owned For
Owner Type
Purchase Details
Closed on
Jan 25, 2016
Sold by
Sebesta Christopher L and Sebesta Jessica
Bought by
Romero Willfredo and Romero Yarin Nayelly
Current Estimated Value
Home Financials for this Owner
Home Financials are based on the most recent Mortgage that was taken out on this home.
Original Mortgage
$203,250
Outstanding Balance
$163,365
Interest Rate
4.37%
Mortgage Type
FHA
Estimated Equity
$154,699
Purchase Details
Closed on
Apr 30, 2002
Sold by
Lightfoot Robert H and Lightfoot Denise R
Bought by
Willis John
Home Financials for this Owner
Home Financials are based on the most recent Mortgage that was taken out on this home.
Original Mortgage
$128,250
Interest Rate
7.11%
Purchase Details
Closed on
Nov 6, 1996
Sold by
Shonk Randolph L and Shonk Barbara J
Bought by
Lightfoot Robert H and Lightfoot Denise R
Home Financials for this Owner
Home Financials are based on the most recent Mortgage that was taken out on this home.
Original Mortgage
$86,450
Interest Rate
8.05%
Create a Home Valuation Report for This Property
The Home Valuation Report is an in-depth analysis detailing your home's value as well as a comparison with similar homes in the area
Home Values in the Area
Average Home Value in this Area
Purchase History
| Date | Buyer | Sale Price | Title Company |
|---|---|---|---|
| Romero Willfredo | -- | Chicago Title | |
| Willis John | -- | Stewart Title | |
| Lightfoot Robert H | -- | Chicago Title |
Source: Public Records
Mortgage History
| Date | Status | Borrower | Loan Amount |
|---|---|---|---|
| Open | Romero Willfredo | $203,250 | |
| Previous Owner | Willis John | $128,250 | |
| Previous Owner | Lightfoot Robert H | $86,450 |
Source: Public Records
Tax History Compared to Growth
Tax History
| Year | Tax Paid | Tax Assessment Tax Assessment Total Assessment is a certain percentage of the fair market value that is determined by local assessors to be the total taxable value of land and additions on the property. | Land | Improvement |
|---|---|---|---|---|
| 2025 | $7,258 | $345,413 | $50,776 | $294,637 |
| 2024 | $7,258 | $326,838 | $50,776 | $276,062 |
| 2023 | $7,258 | $354,535 | $50,776 | $303,759 |
| 2022 | $6,575 | $282,634 | $44,982 | $237,652 |
| 2021 | $6,016 | $247,543 | $34,078 | $213,465 |
| 2020 | $5,832 | $231,497 | $34,078 | $197,419 |
| 2019 | $6,089 | $234,270 | $34,078 | $200,192 |
| 2018 | $2,766 | $206,413 | $24,877 | $181,536 |
| 2017 | $5,314 | $206,413 | $24,877 | $181,536 |
| 2016 | $4,720 | $185,407 | $24,877 | $160,530 |
| 2015 | $3,619 | $176,388 | $24,877 | $151,511 |
| 2014 | $3,619 | $156,331 | $24,877 | $131,454 |
Source: Public Records
Map
Nearby Homes
- 11814 Golden Pine Dr
- 15207 Hillbrook Ct
- 15214 River Park Dr
- 15326 Gettysburg Dr
- 11707 Hillbrook Dr
- 15215 River Park Dr
- 15102 Rolling Oaks Dr
- 15014 River Park Dr
- 11614 Brookfalls Dr
- 15118 Stillcreek Dr
- 15406 Winterhaven Dr
- 15420 Winterhaven Dr
- 15418 Waldwick Dr
- 11715 Park Creek Dr
- 11926 Brandy Ln
- 15415 Kenny Dr
- 15522 Waldwick Dr
- 14918 Shady Bend Dr
- 15627 Gettysburg Dr
- 11410 Rothglen St
- 11814 Hillbrook Dr
- 11810 Hillbrook Dr
- 11826 Hillbrook Dr
- 11819 Hillbrook Dr
- 11823 Hillbrook Dr
- 11806 Hillbrook Dr
- 11830 Hillbrook Dr
- 11815 Hillbrook Dr
- 11811 Hillbrook Dr
- 11831 Hillbrook Dr
- 11815 Rue Beaujon Ct
- 11819 Rue Beaujon Ct
- 11811 Rue Beaujon Ct
- 11834 Hillbrook Dr
- 11802 Hillbrook Dr
- 11807 Hillbrook Dr
- 11818 Stillwater Dr
- 11823 Rue Beaujon Ct
- 11807 Rue Beaujon Ct
- 11835 Hillbrook Dr