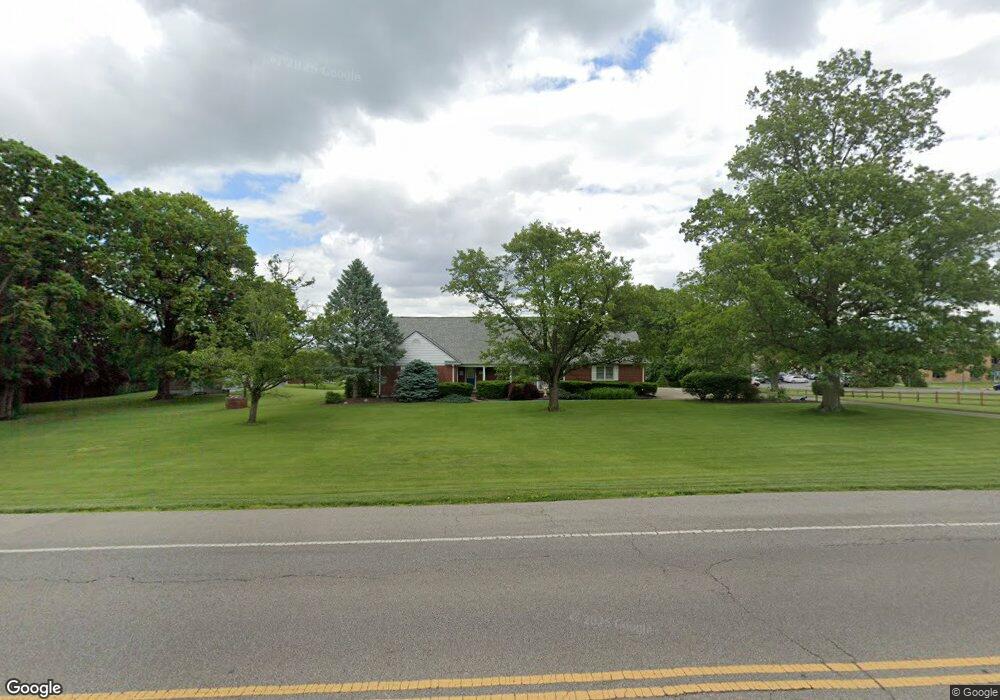
11818 Pippin Rd Cincinnati, OH 45231
Pleasant Run NeighborhoodEstimated Value: $359,000 - $401,000
4
Beds
3
Baths
2,517
Sq Ft
$148/Sq Ft
Est. Value
About This Home
This home is located at 11818 Pippin Rd, Cincinnati, OH 45231 and is currently estimated at $373,649, approximately $148 per square foot. 11818 Pippin Rd is a home located in Hamilton County with nearby schools including Pleasant Run Elementary School, Pleasant Run Middle School, and Northwest High School.
Ownership History
Date
Name
Owned For
Owner Type
Purchase Details
Closed on
Jan 10, 2022
Sold by
Gibbons Michael P and Gibbons Doris A
Bought by
Gibbons Micheal P and Gibbons Doris A
Current Estimated Value
Home Financials for this Owner
Home Financials are based on the most recent Mortgage that was taken out on this home.
Original Mortgage
$111,000
Outstanding Balance
$73,266
Interest Rate
2.33%
Mortgage Type
New Conventional
Estimated Equity
$300,383
Purchase Details
Closed on
Jan 27, 2000
Sold by
Gibbons Michael P and Gibbons Doris A
Bought by
Day John P and Day Jacqueline
Purchase Details
Closed on
Jan 2, 1998
Sold by
Fischer Frank J and Fischer Mary K
Bought by
Gibbons Michael P and Gibbons Doris A
Purchase Details
Closed on
Feb 24, 1995
Sold by
Froehlich John J and Froehlich Beverly T
Bought by
Fischer Frank J and Fischer Mary K
Home Financials for this Owner
Home Financials are based on the most recent Mortgage that was taken out on this home.
Original Mortgage
$144,000
Interest Rate
9.21%
Purchase Details
Closed on
Jan 6, 1994
Sold by
Froehlich Bernard R
Bought by
Froehlich John J
Purchase Details
Closed on
Dec 6, 1993
Sold by
Froehlich Bernard R
Bought by
Froehlich John J
Create a Home Valuation Report for This Property
The Home Valuation Report is an in-depth analysis detailing your home's value as well as a comparison with similar homes in the area
Home Values in the Area
Average Home Value in this Area
Purchase History
| Date | Buyer | Sale Price | Title Company |
|---|---|---|---|
| Gibbons Micheal P | -- | Ashby Todd P | |
| Gibbons Micheal P | -- | None Listed On Document | |
| Day John P | -- | -- | |
| Gibbons Michael P | $170,700 | -- | |
| Day John P | $19,400 | -- | |
| Fischer Frank J | -- | -- | |
| Froehlich John J | -- | -- | |
| Froehlich Beverly T | -- | -- | |
| Froehlich John J | -- | -- | |
| Froehlich Beverly T | -- | -- |
Source: Public Records
Mortgage History
| Date | Status | Borrower | Loan Amount |
|---|---|---|---|
| Open | Gibbons Micheal P | $111,000 | |
| Previous Owner | Fischer Frank J | $144,000 |
Source: Public Records
Tax History Compared to Growth
Tax History
| Year | Tax Paid | Tax Assessment Tax Assessment Total Assessment is a certain percentage of the fair market value that is determined by local assessors to be the total taxable value of land and additions on the property. | Land | Improvement |
|---|---|---|---|---|
| 2024 | $5,623 | $105,067 | $23,692 | $81,375 |
| 2023 | $5,654 | $105,067 | $23,692 | $81,375 |
| 2022 | $4,488 | $67,949 | $23,296 | $44,653 |
| 2021 | $4,453 | $67,949 | $23,296 | $44,653 |
| 2020 | $4,495 | $67,949 | $23,296 | $44,653 |
| 2019 | $4,083 | $57,586 | $19,744 | $37,842 |
| 2018 | $3,664 | $57,586 | $19,744 | $37,842 |
| 2017 | $3,474 | $57,586 | $19,744 | $37,842 |
| 2016 | $2,894 | $47,201 | $20,783 | $26,418 |
| 2015 | $2,919 | $47,201 | $20,783 | $26,418 |
| 2014 | $2,924 | $47,201 | $20,783 | $26,418 |
| 2013 | $2,784 | $47,201 | $20,783 | $26,418 |
Source: Public Records
Map
Nearby Homes
- 11950 Pippin Rd
- 2681 Haverknoll Dr
- 11888 Kittrun Ct
- 2617 Haverknoll Dr
- 11992 Pippin Rd
- 11955 Merrion Ct
- 2520 Willowspring Ct
- 11916 Abbeytown Dr
- 2545 Haverknoll Dr
- 2439 Hazelcrest Ln
- 12058 Wincanton Dr
- 11492 Pippin Rd
- 11500 Gravenhurst Dr
- 2892 Spruceway Dr
- 12052 Doe Run Ct
- 12120 Regency Run Ct
- 12017 Brookway Dr
- 6367 Jamesfield Ct
- 2487 Stockport Ct
- 3169 John Gray Rd
- 11821 Wincanton Dr
- 11825 Wincanton Dr
- 11840 Pippin Rd
- 11829 Wincanton Dr
- 11820 Wincanton Dr
- 11833 Wincanton Dr
- 11822 Wincanton Dr
- 11835 Wincanton Dr
- 11834 Wincanton Dr
- 11866 Pippin Rd
- 11824 Wincanton Dr
- 11839 Wincanton Dr
- 11846 Wincanton Dr
- 11826 Wincanton Dr
- 11845 Wincanton Dr
- 11852 Wincanton Dr
- 2709 W Kemper Rd
- 2659 W Kemper Rd
- 2621 W Kemper Rd
- 11851 Wincanton Dr