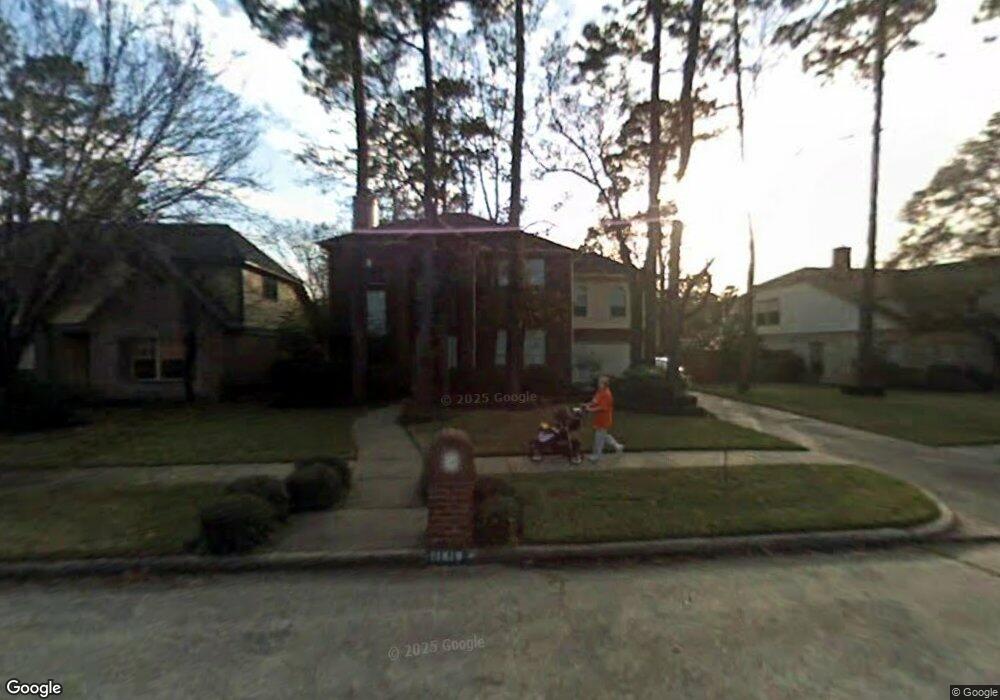
11819 Park Creek Dr Houston, TX 77070
Estimated Value: $324,000 - $343,000
4
Beds
3
Baths
2,620
Sq Ft
$128/Sq Ft
Est. Value
About This Home
This home is located at 11819 Park Creek Dr, Houston, TX 77070 and is currently estimated at $335,585, approximately $128 per square foot. 11819 Park Creek Dr is a home located in Harris County with nearby schools including Lakewood Elementary School, Willow Wood Junior High School, and Northpointe Intermediate School.
Ownership History
Date
Name
Owned For
Owner Type
Purchase Details
Closed on
Apr 20, 2005
Sold by
Ford Gregory S and Ford Ann M
Bought by
Velez Abraham E and Velez Karen G
Current Estimated Value
Home Financials for this Owner
Home Financials are based on the most recent Mortgage that was taken out on this home.
Original Mortgage
$132,515
Outstanding Balance
$82,240
Interest Rate
9.07%
Mortgage Type
Fannie Mae Freddie Mac
Estimated Equity
$253,345
Purchase Details
Closed on
May 19, 1994
Sold by
Dubose Home Corp
Bought by
Ford Gregory S and Ford Ann M
Purchase Details
Closed on
Dec 16, 1993
Sold by
Weswin Inc
Bought by
Dubose Home Corp
Home Financials for this Owner
Home Financials are based on the most recent Mortgage that was taken out on this home.
Original Mortgage
$18,143
Interest Rate
7.12%
Mortgage Type
Purchase Money Mortgage
Create a Home Valuation Report for This Property
The Home Valuation Report is an in-depth analysis detailing your home's value as well as a comparison with similar homes in the area
Home Values in the Area
Average Home Value in this Area
Purchase History
| Date | Buyer | Sale Price | Title Company |
|---|---|---|---|
| Velez Abraham E | -- | First American Title | |
| Ford Gregory S | -- | Stewart Title | |
| Dubose Home Corp | -- | Stewart Title Houston Divisi |
Source: Public Records
Mortgage History
| Date | Status | Borrower | Loan Amount |
|---|---|---|---|
| Open | Velez Abraham E | $132,515 | |
| Previous Owner | Dubose Home Corp | $18,143 | |
| Closed | Velez Abraham E | $23,385 |
Source: Public Records
Tax History Compared to Growth
Tax History
| Year | Tax Paid | Tax Assessment Tax Assessment Total Assessment is a certain percentage of the fair market value that is determined by local assessors to be the total taxable value of land and additions on the property. | Land | Improvement |
|---|---|---|---|---|
| 2025 | $6,064 | $361,043 | $50,891 | $310,152 |
| 2024 | $6,064 | $340,925 | $50,891 | $290,034 |
| 2023 | $6,064 | $370,707 | $50,891 | $319,816 |
| 2022 | $6,602 | $323,851 | $45,085 | $278,766 |
| 2021 | $6,271 | $258,019 | $34,155 | $223,864 |
| 2020 | $6,049 | $240,097 | $34,155 | $205,942 |
| 2019 | $6,159 | $242,958 | $34,155 | $208,803 |
| 2018 | $2,552 | $215,433 | $24,934 | $190,499 |
| 2017 | $5,546 | $215,433 | $24,934 | $190,499 |
| 2016 | $5,071 | $204,751 | $24,934 | $179,817 |
| 2015 | $3,905 | $193,721 | $24,934 | $168,787 |
| 2014 | $3,905 | $169,555 | $24,934 | $144,621 |
Source: Public Records
Map
Nearby Homes
- 15014 River Park Dr
- 15102 Rolling Oaks Dr
- 11715 Park Creek Dr
- 11814 Golden Pine Dr
- 15118 Stillcreek Dr
- 14918 Shady Bend Dr
- 11614 Brookfalls Dr
- 14907 Pine Point Ct
- 15207 Hillbrook Ct
- 11707 Hillbrook Dr
- 15214 River Park Dr
- 14902 Forest Lodge Dr
- 14615 Sunny Grove Dr
- 15215 River Park Dr
- 15326 Gettysburg Dr
- 11807 Primwood Dr
- 15406 Winterhaven Dr
- 12120 Silver Creek Dr
- 11723 Quail Creek Dr
- 11927 Oakcroft Dr
- 11823 Park Creek Dr
- 11815 Park Creek Dr
- 11811 Park Creek Dr
- 11827 Park Creek Dr
- 11807 Park Creek Dr
- 11822 Park Creek Dr
- 15002 Rolling Oaks Dr
- 11831 Park Creek Dr
- 11826 Park Creek Dr
- 15006 Rolling Oaks Dr
- 11803 Park Creek Dr
- 11903 Park Creek Dr
- 11830 Park Creek Dr
- 15003 Forest Lodge Dr
- 15003 River Park Dr
- 15011 River Park Dr
- 15010 Rolling Oaks Dr
- 14820 Sandy Creek Dr
- 14822 Sandy Creek Dr
- 15015 River Park Dr