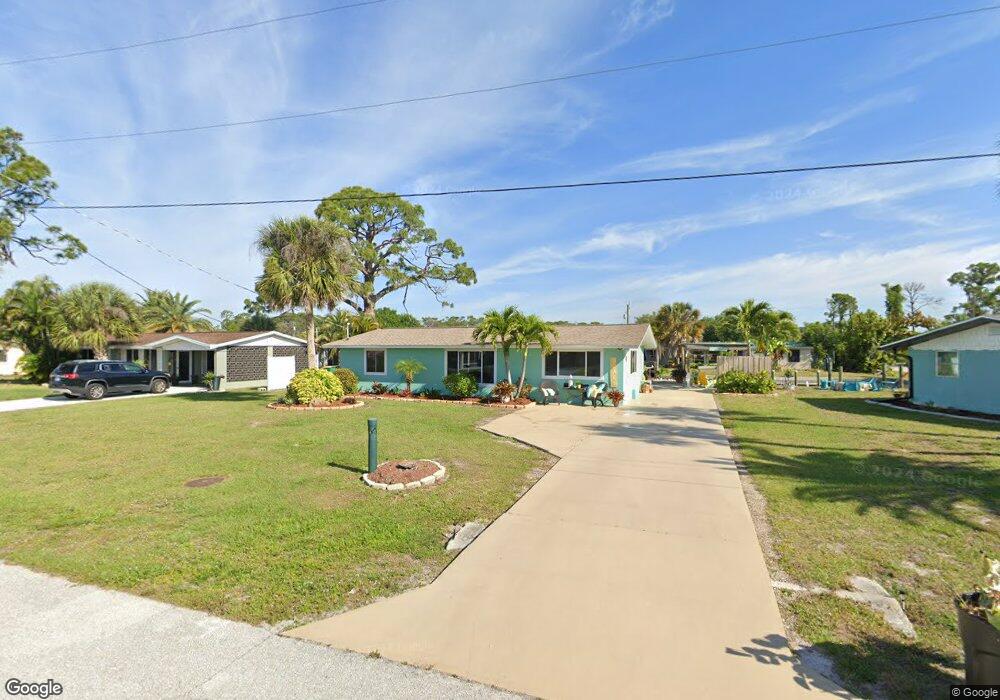
1182 Clark St Englewood, FL 34224
Englewood South NeighborhoodEstimated Value: $246,955 - $325,000
2
Beds
1
Bath
1,144
Sq Ft
$254/Sq Ft
Est. Value
About This Home
This home is located at 1182 Clark St, Englewood, FL 34224 and is currently estimated at $290,239, approximately $253 per square foot. 1182 Clark St is a home located in Charlotte County with nearby schools including Myakka River Elementary School, L.A. Ainger Middle School, and Lemon Bay High School.
Ownership History
Date
Name
Owned For
Owner Type
Purchase Details
Closed on
Jul 30, 2024
Sold by
Miller Stephanie P
Bought by
Miller Stephanie P and Miller Brooke Nicole
Current Estimated Value
Purchase Details
Closed on
Jun 1, 2016
Bought by
Miller Stephanie P
Purchase Details
Closed on
Mar 19, 2015
Sold by
Pate Bibbson
Bought by
Pate Mattie Joe and Miller Stephanie P
Purchase Details
Closed on
Jul 22, 1996
Sold by
Hatzaetos Andrew T and Hatzaetos Mary T
Bought by
Pate Bibbson and Pate Mattie Joe
Home Financials for this Owner
Home Financials are based on the most recent Mortgage that was taken out on this home.
Original Mortgage
$49,752
Interest Rate
8.36%
Create a Home Valuation Report for This Property
The Home Valuation Report is an in-depth analysis detailing your home's value as well as a comparison with similar homes in the area
Home Values in the Area
Average Home Value in this Area
Purchase History
| Date | Buyer | Sale Price | Title Company |
|---|---|---|---|
| Miller Stephanie P | -- | None Listed On Document | |
| Miller Stephanie P | $100 | -- | |
| Pate Mattie Joe | -- | None Available | |
| Pate Bibbson | $56,000 | -- |
Source: Public Records
Mortgage History
| Date | Status | Borrower | Loan Amount |
|---|---|---|---|
| Previous Owner | Pate Bibbson | $49,752 |
Source: Public Records
Tax History Compared to Growth
Tax History
| Year | Tax Paid | Tax Assessment Tax Assessment Total Assessment is a certain percentage of the fair market value that is determined by local assessors to be the total taxable value of land and additions on the property. | Land | Improvement |
|---|---|---|---|---|
| 2023 | $3,607 | $134,914 | $0 | $0 |
| 2022 | $3,118 | $177,197 | $83,096 | $94,101 |
| 2021 | $2,682 | $120,037 | $47,301 | $72,736 |
| 2020 | $2,744 | $124,131 | $49,538 | $74,593 |
| 2019 | $2,876 | $124,475 | $49,538 | $74,937 |
| 2018 | $2,106 | $118,830 | $0 | $0 |
| 2017 | $2,083 | $116,386 | $44,105 | $72,281 |
| 2016 | $2,556 | $110,063 | $0 | $0 |
| 2015 | $2,349 | $98,473 | $0 | $0 |
| 2014 | $2,208 | $89,917 | $0 | $0 |
Source: Public Records
Map
Nearby Homes