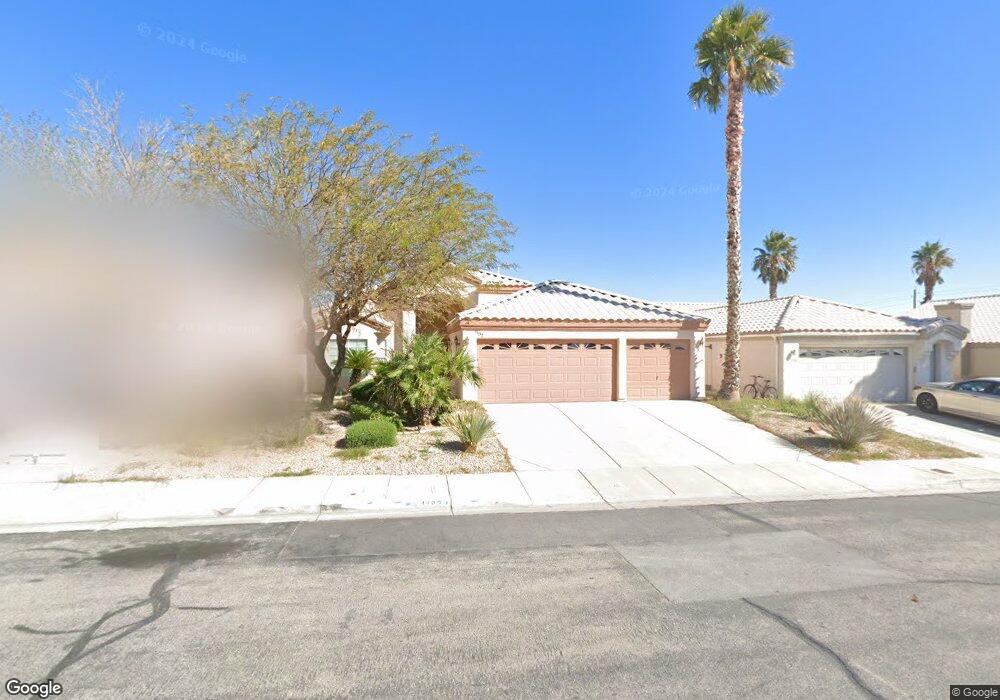
1182 Expectation Ct Henderson, NV 89002
River Mountain NeighborhoodEstimated Value: $420,150 - $457,000
3
Beds
2
Baths
1,671
Sq Ft
$263/Sq Ft
Est. Value
About This Home
This home is located at 1182 Expectation Ct, Henderson, NV 89002 and is currently estimated at $439,288, approximately $262 per square foot. 1182 Expectation Ct is a home located in Clark County with nearby schools including John Dooley Elementary School, B Mahlon Brown Academy of International Studies, and Basic Academy of International Studies.
Ownership History
Date
Name
Owned For
Owner Type
Purchase Details
Closed on
Jun 24, 2022
Sold by
Wisniewski Jr Daniel J
Bought by
Wisniewski Daniel J
Current Estimated Value
Home Financials for this Owner
Home Financials are based on the most recent Mortgage that was taken out on this home.
Original Mortgage
$285,000
Outstanding Balance
$269,964
Interest Rate
5.25%
Mortgage Type
New Conventional
Estimated Equity
$169,324
Purchase Details
Closed on
Apr 5, 2022
Sold by
Wisniewski Jr Daniel J
Bought by
Wisniewski Daniel J and Wisniewski Michael W
Purchase Details
Closed on
Jun 30, 2006
Sold by
Wisniewski Mary Lou
Bought by
Wisniewski Daniel J and Wisniewski Michael W
Purchase Details
Closed on
Sep 12, 2000
Sold by
Muniz Marlon J and Muniz Beverly J
Bought by
Wisniewski Daniel J and Wisniewski Mary Louise
Home Financials for this Owner
Home Financials are based on the most recent Mortgage that was taken out on this home.
Original Mortgage
$20,000
Interest Rate
8.11%
Create a Home Valuation Report for This Property
The Home Valuation Report is an in-depth analysis detailing your home's value as well as a comparison with similar homes in the area
Home Values in the Area
Average Home Value in this Area
Purchase History
| Date | Buyer | Sale Price | Title Company |
|---|---|---|---|
| Wisniewski Daniel J | $435,000 | Fidelity National Title | |
| Wisniewski Michael W | -- | Fidelity National Title | |
| Wisniewski Daniel J | -- | None Listed On Document | |
| Wisniewski Daniel J | -- | None Available | |
| Wisniewski Daniel J | $139,990 | United Title |
Source: Public Records
Mortgage History
| Date | Status | Borrower | Loan Amount |
|---|---|---|---|
| Open | Wisniewski Daniel J | $285,000 | |
| Previous Owner | Wisniewski Daniel J | $20,000 |
Source: Public Records
Tax History
| Year | Tax Paid | Tax Assessment Tax Assessment Total Assessment is a certain percentage of the fair market value that is determined by local assessors to be the total taxable value of land and additions on the property. | Land | Improvement |
|---|---|---|---|---|
| 2026 | $1,768 | $94,656 | $37,100 | $57,556 |
| 2025 | $1,717 | $86,794 | $28,000 | $58,794 |
| 2024 | $1,667 | $86,794 | $28,000 | $58,794 |
| 2023 | $1,667 | $90,241 | $33,950 | $56,291 |
| 2022 | $1,619 | $80,315 | $28,700 | $51,615 |
| 2021 | $1,572 | $75,878 | $26,600 | $49,278 |
| 2020 | $1,523 | $75,637 | $26,600 | $49,037 |
| 2019 | $1,479 | $68,065 | $19,600 | $48,465 |
| 2018 | $1,436 | $65,493 | $18,550 | $46,943 |
| 2017 | $1,912 | $65,946 | $18,200 | $47,746 |
| 2016 | $1,360 | $57,869 | $9,800 | $48,069 |
| 2015 | $1,357 | $50,740 | $9,800 | $40,940 |
| 2014 | $1,317 | $45,896 | $9,100 | $36,796 |
Source: Public Records
Map
Nearby Homes
- 2012 Houdini St
- 1911 Red Sand Ct
- 2050 S Magic Way Unit 201
- 2050 S Magic Way Unit 191
- 2050 S Magic Way Unit 203
- 2050 S Magic Way Unit 210
- 2050 S Magic Way Unit 291
- 2050 S Magic Way Unit 8
- 2050 S Magic Way Unit 274
- 727 Triple Crown St
- 1054 Langston Ranch Ave
- 607 Sylvan St
- 717 Triple Crown St
- 1872 Longmeadow St
- 664 Sunrise Lake Place
- 2002 Darla St
- 2011 Darla St
- 2031 Buckeye Reef St
- 540 Big Lake St
- 700 Sea Coast Dr
- 1186 Expectation Ct
- 1178 Expectation Ct
- 1183 King Arthur Ct Unit None
- 1183 King Arthur Ct
- 1187 King Arthur Ct
- 1190 Expectation Ct
- 1174 Expectation Ct
- 1183 Expectation Ct
- 1191 King Arthur Ct
- 1175 King Arthur Ct
- 1179 Expectation Ct
- 1194 Expectation Ct
- 1191 Expectation Ct
- 1195 King Arthur Ct
- 1170 Expectation Ct
- 1175 Expectation Ct
- 1195 Expectation Ct
- 1171 King Arthur Ct
- 1171 Expectation Ct
- 1182 King Arthur Ct Unit 2
Your Personal Tour Guide
Ask me questions while you tour the home.