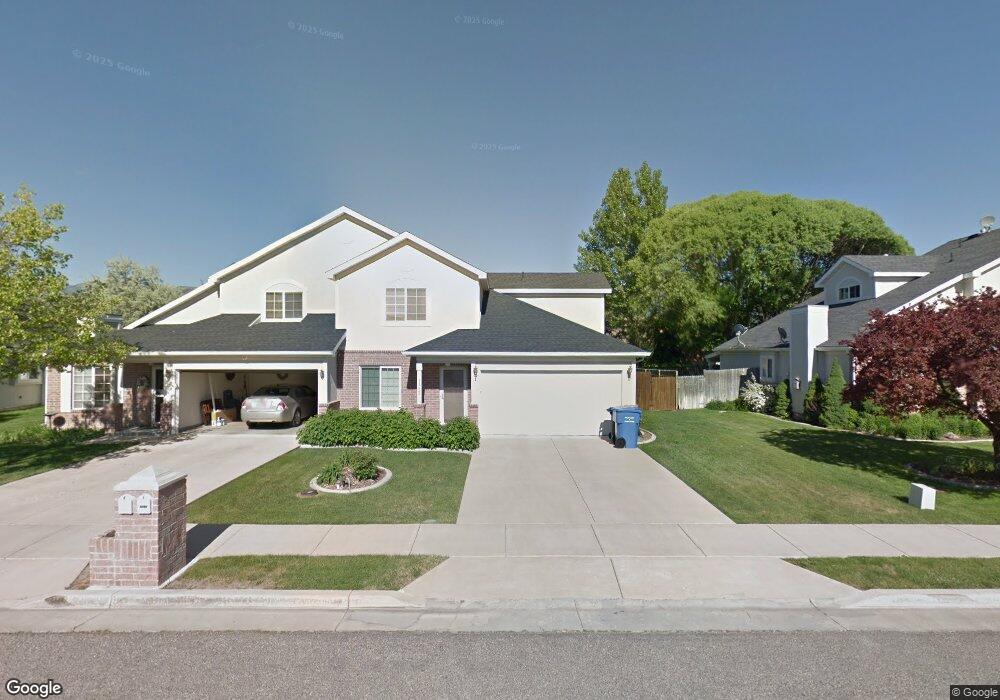
1182 N 320 W Logan, UT 84341
Bridger NeighborhoodEstimated Value: $313,000 - $374,424
3
Beds
2
Baths
1,476
Sq Ft
$231/Sq Ft
Est. Value
About This Home
This home is located at 1182 N 320 W, Logan, UT 84341 and is currently estimated at $340,856, approximately $230 per square foot. 1182 N 320 W is a home located in Cache County with nearby schools including Bridger School, Mount Logan Middle School, and Logan High School.
Ownership History
Date
Name
Owned For
Owner Type
Purchase Details
Closed on
Feb 4, 2008
Sold by
Carlson Kathryn H
Bought by
Kulyukin Vladimir and Kulyukin Deborah
Current Estimated Value
Purchase Details
Closed on
Oct 11, 2005
Sold by
Verlin Donald G and Verlin Serena K
Bought by
Carlson Kathryn H
Home Financials for this Owner
Home Financials are based on the most recent Mortgage that was taken out on this home.
Original Mortgage
$96,220
Interest Rate
5.63%
Mortgage Type
New Conventional
Purchase Details
Closed on
Nov 26, 2001
Sold by
Verlin Donald G and Verlin Serena K
Bought by
Verlin Donald G and Verlin Serena K
Home Financials for this Owner
Home Financials are based on the most recent Mortgage that was taken out on this home.
Original Mortgage
$110,000
Interest Rate
6.63%
Purchase Details
Closed on
Jun 19, 2001
Sold by
Verlin Donald G and Verlin Serena K
Bought by
Verlin Donald G and Verlin Serena K
Create a Home Valuation Report for This Property
The Home Valuation Report is an in-depth analysis detailing your home's value as well as a comparison with similar homes in the area
Home Values in the Area
Average Home Value in this Area
Purchase History
| Date | Buyer | Sale Price | Title Company |
|---|---|---|---|
| Kulyukin Vladimir | -- | Heritage West Title | |
| Carlson Kathryn H | -- | Cache Title Company | |
| Verlin Donald G | -- | Pinnacle Title | |
| Verlin Donald G | -- | Pinnacle Title | |
| Verlin Donald G | -- | -- |
Source: Public Records
Mortgage History
| Date | Status | Borrower | Loan Amount |
|---|---|---|---|
| Previous Owner | Carlson Kathryn H | $96,220 | |
| Previous Owner | Verlin Donald G | $110,000 |
Source: Public Records
Tax History
| Year | Tax Paid | Tax Assessment Tax Assessment Total Assessment is a certain percentage of the fair market value that is determined by local assessors to be the total taxable value of land and additions on the property. | Land | Improvement |
|---|---|---|---|---|
| 2025 | $1,551 | $364,781 | $132,600 | $232,181 |
| 2023 | $1,668 | $362,181 | $130,000 | $232,181 |
| 2022 | $1,530 | $310,181 | $78,000 | $232,181 |
| 2021 | $1,311 | $225,745 | $40,000 | $185,745 |
| 2020 | $1,272 | $197,240 | $40,000 | $157,240 |
| 2019 | $1,330 | $197,239 | $40,000 | $157,239 |
| 2018 | $1,305 | $176,730 | $40,000 | $136,730 |
| 2017 | $1,185 | $84,865 | $0 | $0 |
| 2016 | $1,229 | $75,955 | $0 | $0 |
| 2015 | $1,028 | $70,905 | $0 | $0 |
| 2014 | $929 | $70,905 | $0 | $0 |
| 2013 | -- | $70,905 | $0 | $0 |
Source: Public Records
Map
Nearby Homes
Your Personal Tour Guide
Ask me questions while you tour the home.